
by Intellify | Feb 22, 2022 | Blog, BOT, Data Visualization, data-visualization-gallery
Data Visualization: A Gateway to Informed Decision Making Quoting Peter Drucker, “If you can’t measure it, you can’t improve it.” In the world of digitization and big data, the amount of data being generated is ever-increasing, but human perceptual abilities to...
by Intellify | Feb 14, 2022 | Blog, Data Visualization, data-visualization-gallery
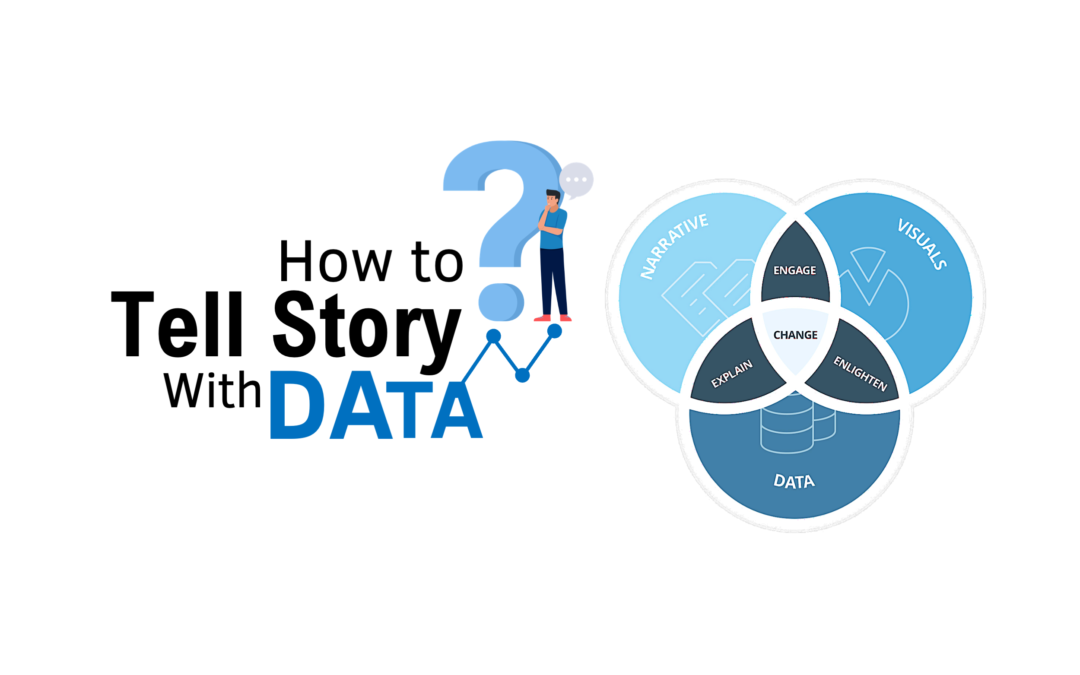
How to Design Story with Data? As we all know – when we tell story along with facts and figures, its more meaningful. Somewhere I had read – We believe in god but trust in Data. As per Brent Dykes author of “Effective Data Storytelling”, there are three pillars of...
by Intellify | Oct 25, 2021 | data-visualization-gallery
View Report Insurance Claims Analysis This report is designed to analyze and visualize overall information related to sales for sales leaders and management to improve strategic planning. A variety of KPI’s tracked on the four majors: Sales values, Product...
by Intellify | Sep 24, 2021 | data-visualization-gallery
View Report Warehouse Operations Overview Managing huge warehouses is a challenging task for any organization. Keeping a track of stock levels, their current status, shelf management requires a lot of human effort, time, and cost to manage it. In addition, it is...
by Intellify | Sep 23, 2021 | data-visualization-gallery
View Report Manufacturing Analytics Dashboard Due to the complex processes in the manufacturing industry, it becomes a challenging and tedious task for the department to track and analyze the data to take business decisions. Herewith Power BI, we are visualizing the...
by Intellify | Sep 23, 2021 | data-visualization-gallery
View Report Annual Sales Performance Dashboard This report is designed to analyze and visualize overall information related to sales for sales leaders and management to improve strategic planning. A variety of KPI’s tracked on the four majors: Sales values, Product...
