
by Intellify | Feb 22, 2022 | Blog, BOT, Data Visualization, data-visualization-gallery
Data Visualization: A Gateway to Informed Decision Making Quoting Peter Drucker, “If you can’t measure it, you can’t improve it.” In the world of digitization and big data, the amount of data being generated is ever-increasing, but human perceptual abilities to...
by Intellify | Feb 14, 2022 | Blog, Data Visualization, data-visualization-gallery
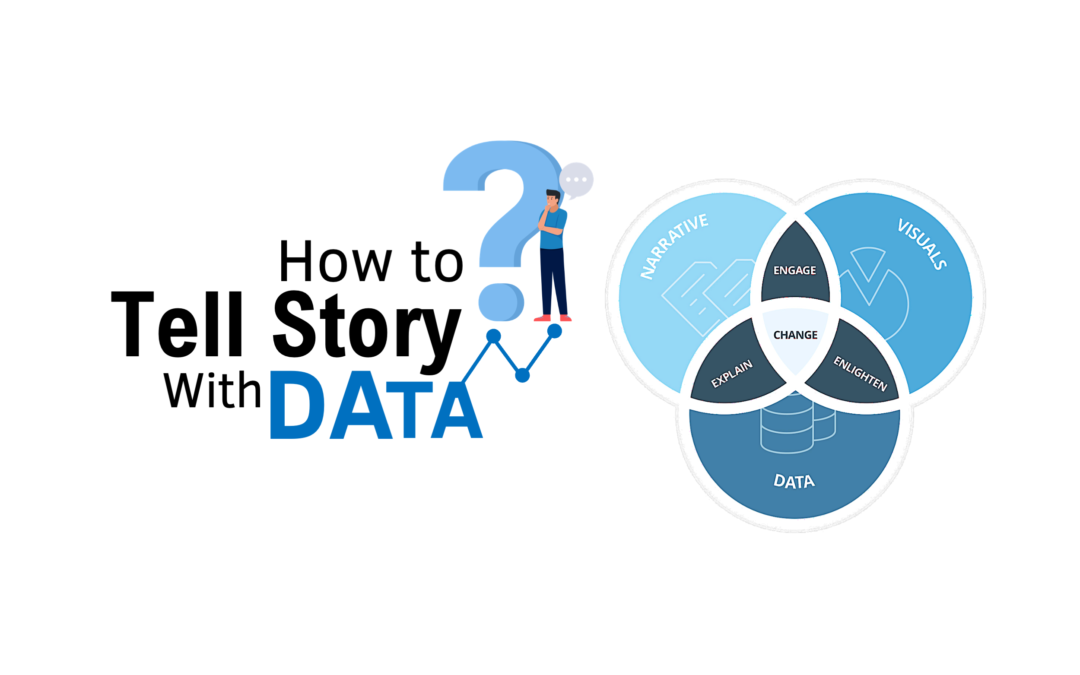
How to Design Story with Data? As we all know – when we tell story along with facts and figures, its more meaningful. Somewhere I had read – We believe in god but trust in Data. As per Brent Dykes author of “Effective Data Storytelling”, there are three pillars of...
by Intellify | Feb 4, 2022 | Blog, Data Visualization
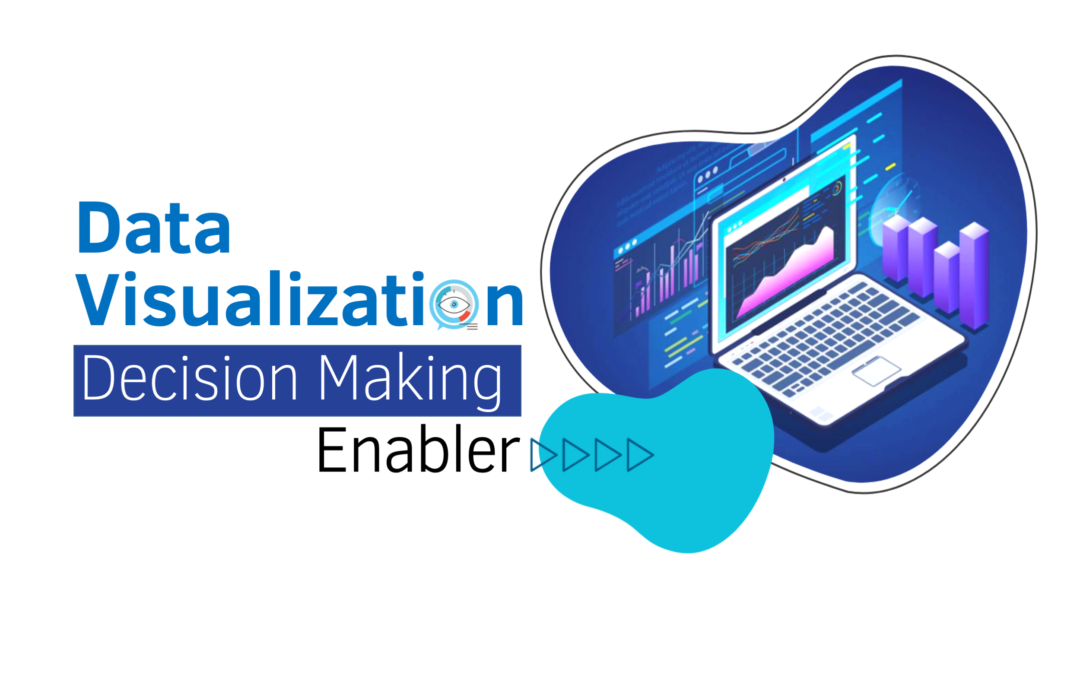
Data visualization : Decision Making Enabler In the age of big data, 72% of businesses are currently collecting the data they will never be able to use. But that doesn’t mean that the data is not useful. It only means that data is not being used properly. Companies...
by Intellify | Jan 31, 2022 | Blog, Data Visualization
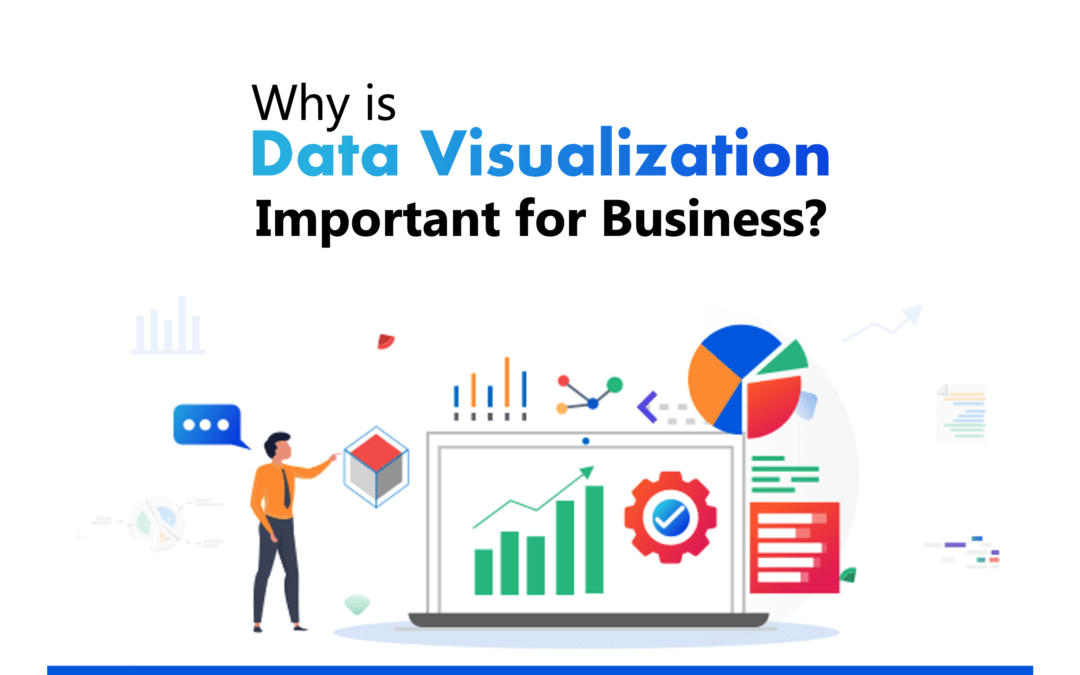
Why is data visualization important for business? A well-known proverb, ‘A picture is worth thousand words’ is well suitable for the Data Visualizations as it can visualize the thousands of data records in the single chart which told us the story on-behalf of the...
by Intellify | Jan 10, 2022 | Blog, Data Visualization
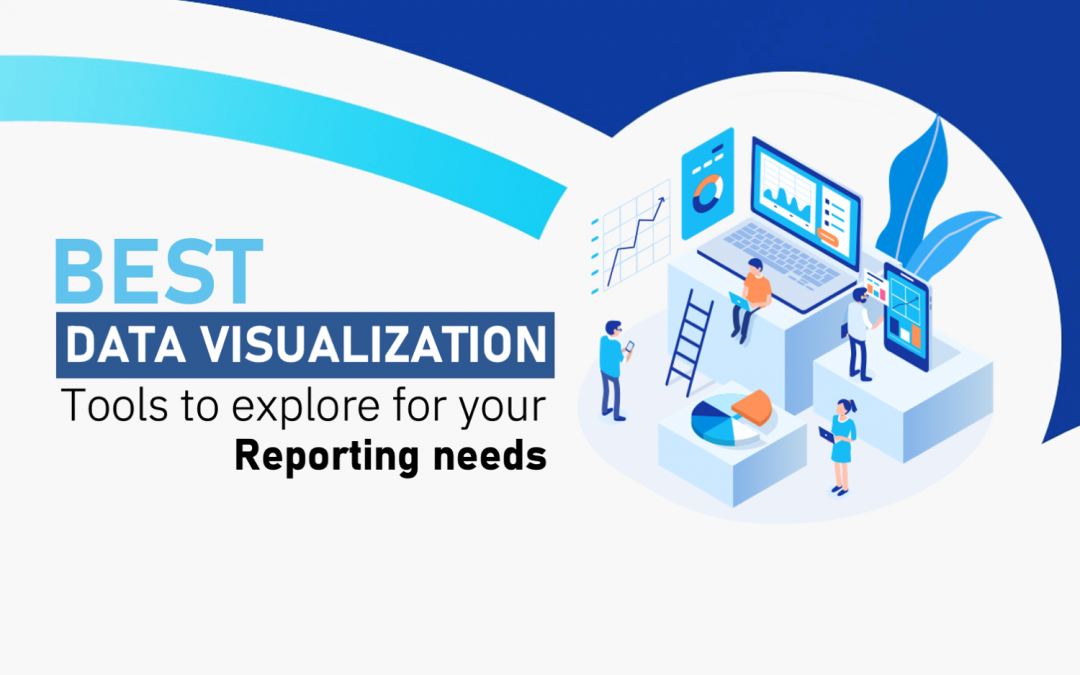
Best Data Visualization Tools to explore for your reporting needs In this age of data and modern-day technology, it is crucial to have capable tools to help your business reach its full potential. It is also extremely important to have a good knowledge of...
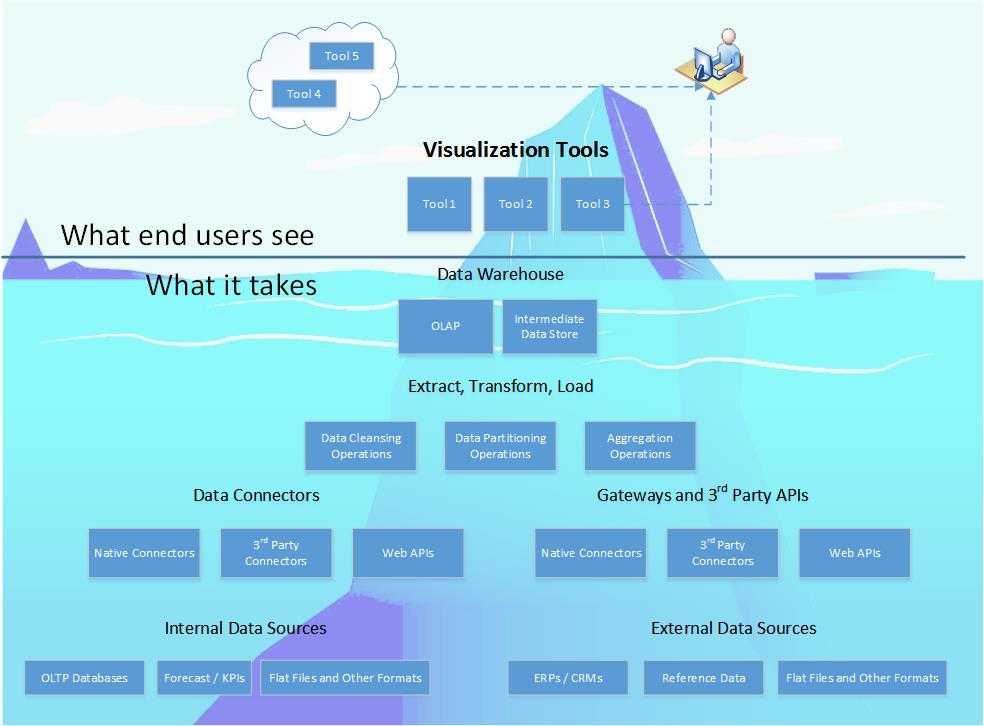
by Intellify | Feb 12, 2019 | Business Intelligence, Data Visualization
Dashboards And Visualizations Are The Tip of The Iceberg Rapid developments in Business Intelligence have resulted in decision makers and BI practitioners engage with new tools for insightful visualizations. The desired objectives are achieved only after in-depth...
