Intellify’s Power BI Services
From data to insight at the speed of Cloud and with the most advanced visualization experience

We believe that true empowerment comes from understanding the data and decisive insights. Our Power BI Services go beyond conventional analytics – they illuminate trends, decode patterns, and provide a profound comprehension of what’s happening, what would happen and what should be done. With Data and Visuals, we Enlighten, With Visuals and Narrative we Engage and With Data and Narrative we Explain thereby enabling Data Driven Decisions.
What is Power BI?
Microsoft Power BI is a leading Business Intelligence tool that transforms data into rich visualizations and interactive reports.
Seamlessly connect to various data sources, discover hidden patterns, and share compelling insights across your organization. Elevate your Data-Driven Strategy with Power BI’s user-friendly interface and data exploration capabilities.
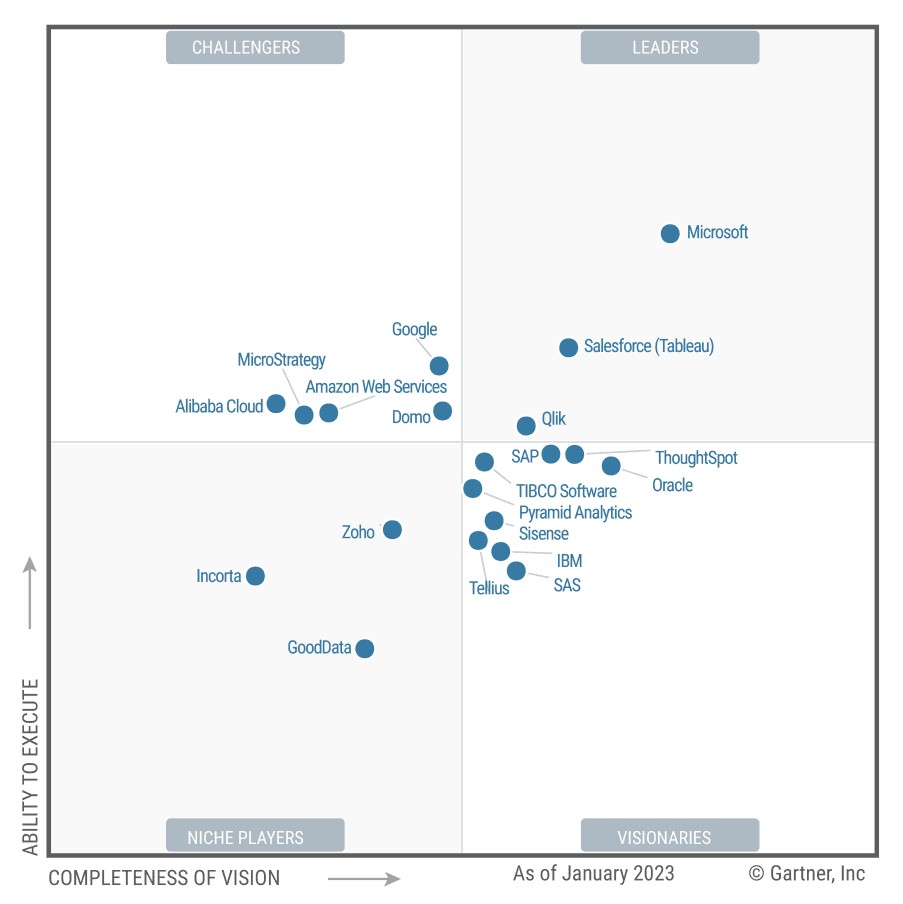
Power BI is a Leader in the 2023 Gartner® Magic Quadrant™ for Analytics and BI Platforms >>>
Power BI Desktop
Empowers to design stunning reports and dashboards by connecting to 100+ data sources. Performing transformations, and crafting interactive visualizations.
Power BI Service
With Pro and Premium licenses, unlock advanced capabilities for seamless data exploration, real-time collaboration, and premium scalability.
Power BI Mobile
Access your reports and dashboards anytime, anywhere. Stay informed and make critical decisions with real-time data insights at your fingertips.

Power BI Embedded
Integrate interactive reports and visuals directly into your applications, websites, or portals, providing your users with seamless data exploration.
Power BI Report Server
Secure on-premises reporting capabilities, enabling you to publish, manage, and access Power BI reports within your organization’s infrastructure.
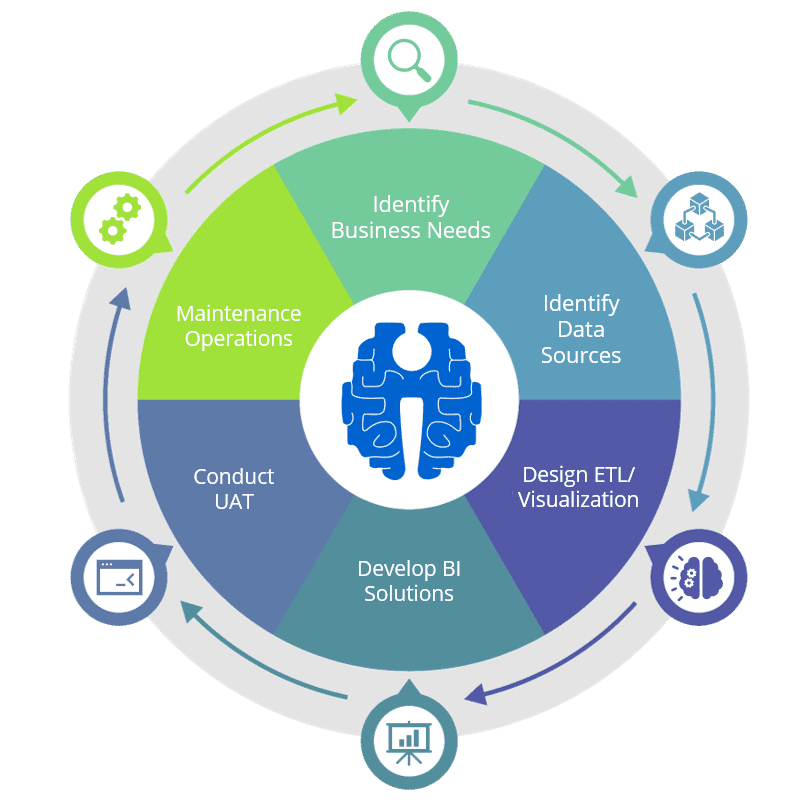
Our Approach
We embrace a partnership model that unlocks the full potential of your data using capabilities of Power BI. Our consultative journey starts by comprehending your distinct business challenges and goals, enabling us to tailor solutions that seamlessly align with your objectives.
With our team of 100% Microsoft Certified Consultants, we harness the complete range of Power BI’s capabilities to deliver actionable insights. From data modeling and transformation to crafting intuitive visualizations, we help you create personalized and impactful data-stories enabling Data Driven Decision Making.
Start your Power BI Journey with Intellify Solutions
Why choose Power BI?
Power BI is a revolutionary reporting tool that transforms the way you view, interact with and understand your data to generate a 360-degree view of the business in minimal time.
Industry leader
Recognized by leading Technology Research firms, Power BI is empowering businesses with cutting-edge analytics to drive data-driven decisions.

Easily accessible insights with Microsoft AI
Unlock unparalleled insights through seamless integration with Microsoft AI, revealing hidden patterns and trends within your data

Real time Insights
Harness the power of real-time data, transforming dynamic information into actionable insights for swift decision-making.

100+ pre-build connectors
Access a vast array of data sources effortlessly, Power BI’s has an extensive library of over 100 pre-built connectors.

Data governance & Security
Power BI ensures peace of mind with robust data governance and top-tier security measures, keeping your information safe and compliant.

Best in class mobile experience
Take your insights on the go with a best-in-class mobile experience, enabling you to access and interact with your data wherever you are.
Our Solutions on Power BI Partner Showcase
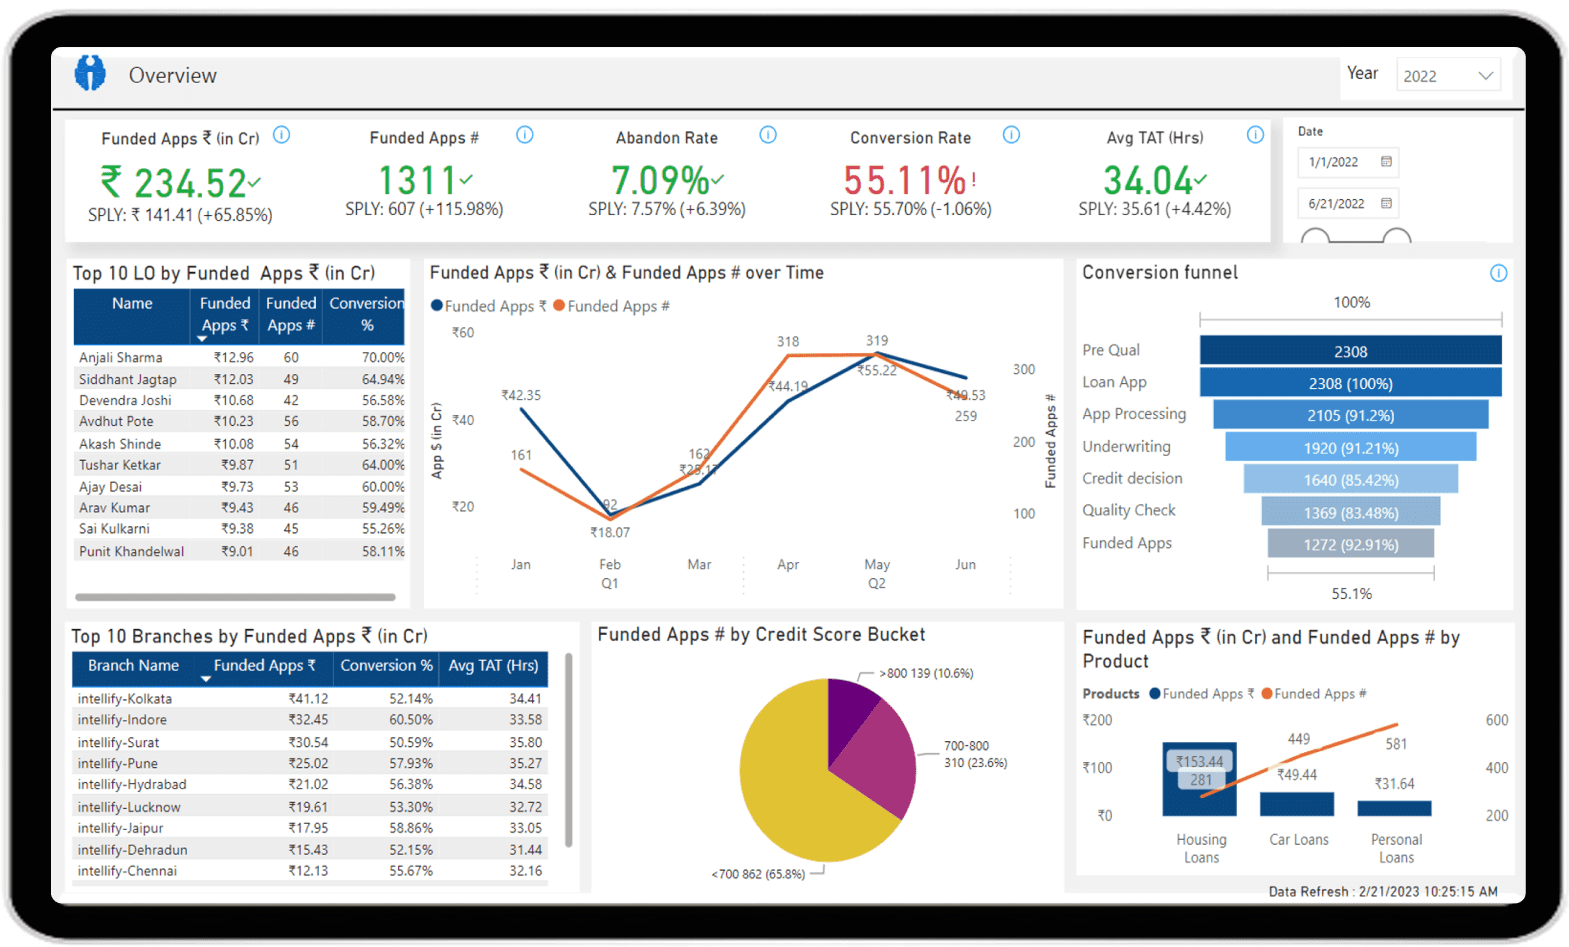
Lending Analytics
Our ready-to-use solution comprises of 18+ persona specific dashboards tracking 100+ KPIs for 3 major processes- LOS, LMS and Delinquency.
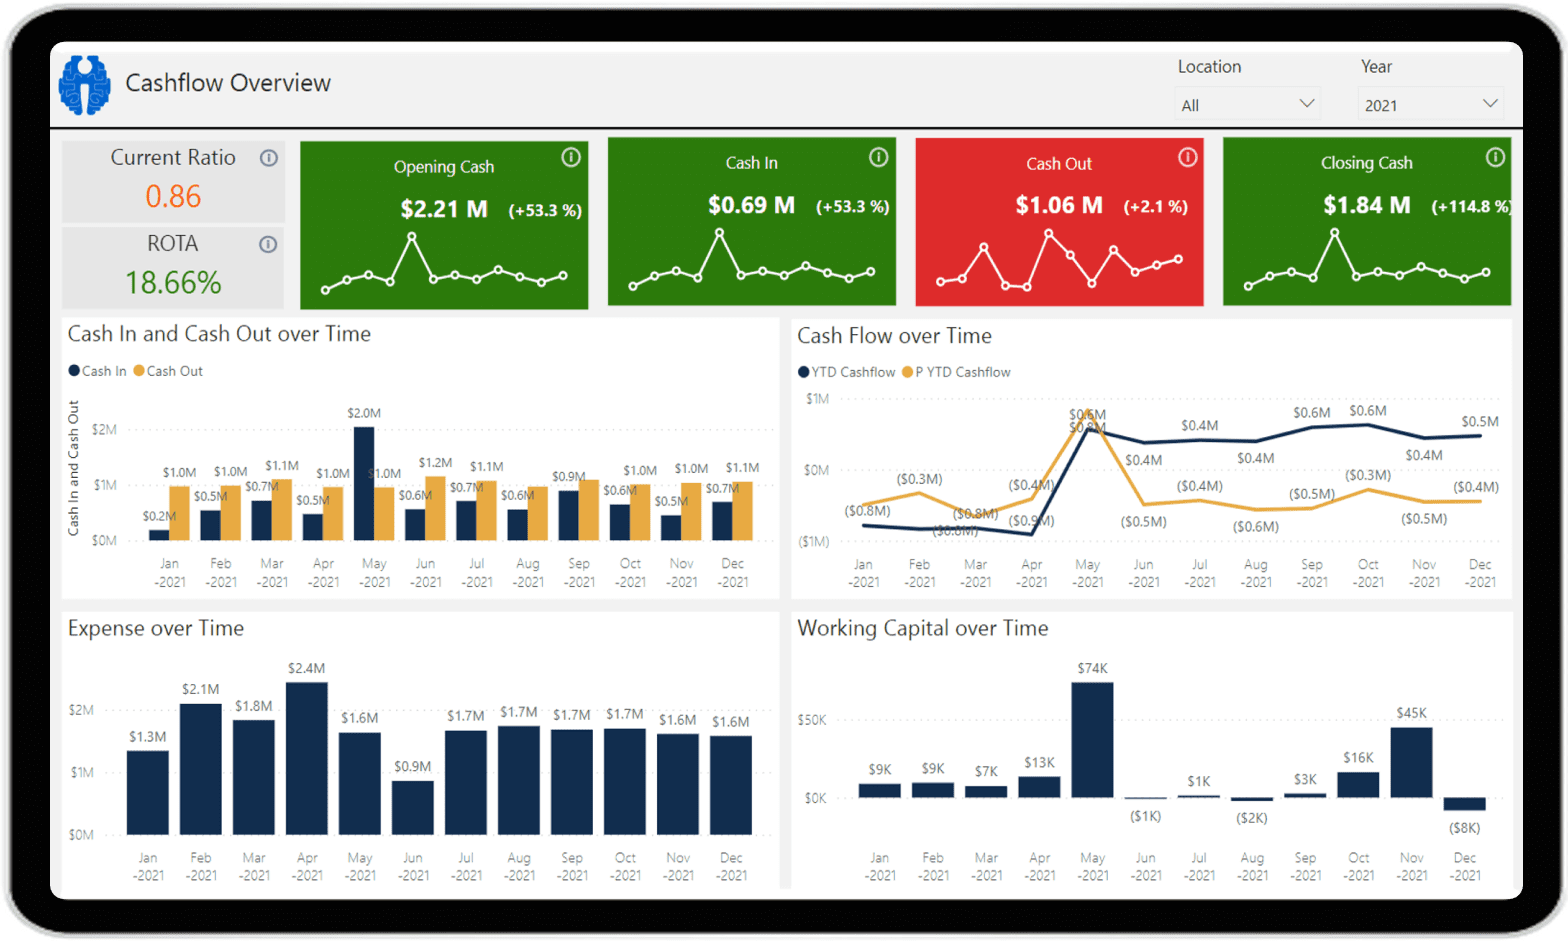
Financial Analytics
Interpreting critical Business Financials easy with our Financial Analytics Solution!
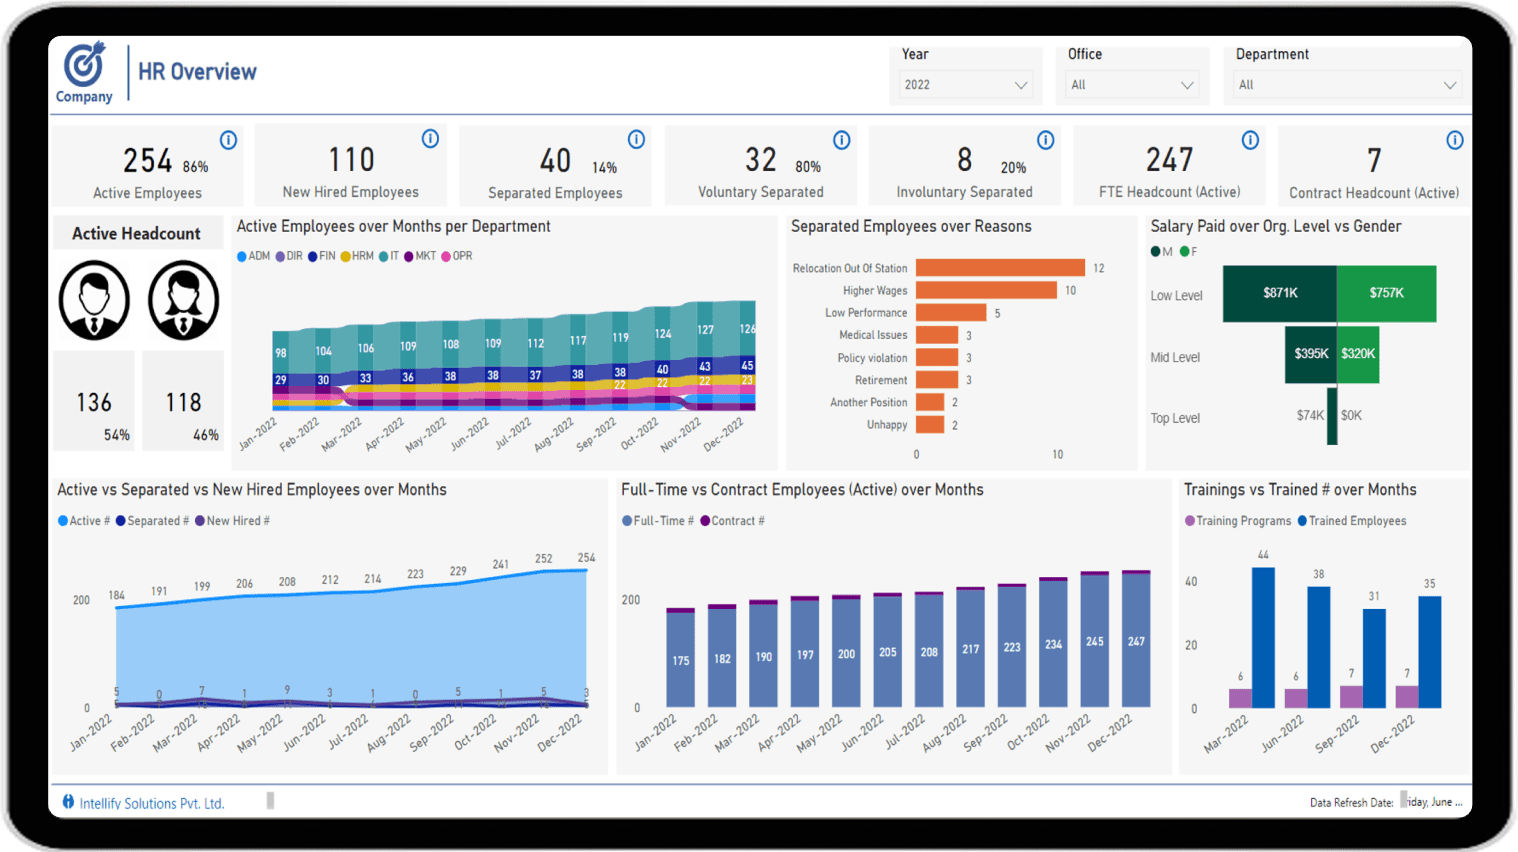
HR Analytics
A comprehensive analytics solution that empowers HR professionals with Data-Driven Intelligence to support Strategic Decision-Making.
Power BI Case Studies

Power BI solution for a leading manufacturing company

Microsoft BI solution for leading African Bank

Power Automate solution for the simplified data management
We work across power platform ecosystem

Power BI
Our certified team and success in serving diverse business verticals with Power BI sets us apart.

Power Automate
Our proven methodology to identify processes to automate helps you get the most out of Power Automate.

Power Apps
We help drive business transformation by helping you leverage the utilities of Power Apps.
