

Annual Sales Performance Dashboard
This report is designed to analyze and visualize overall information related to sales for sales leaders and management to improve strategic planning. A variety of KPI’s tracked on the four majors: Sales values, Product categories, Sales executives, and New customers as it is having a major focus to grow these accounts.
 (1)")


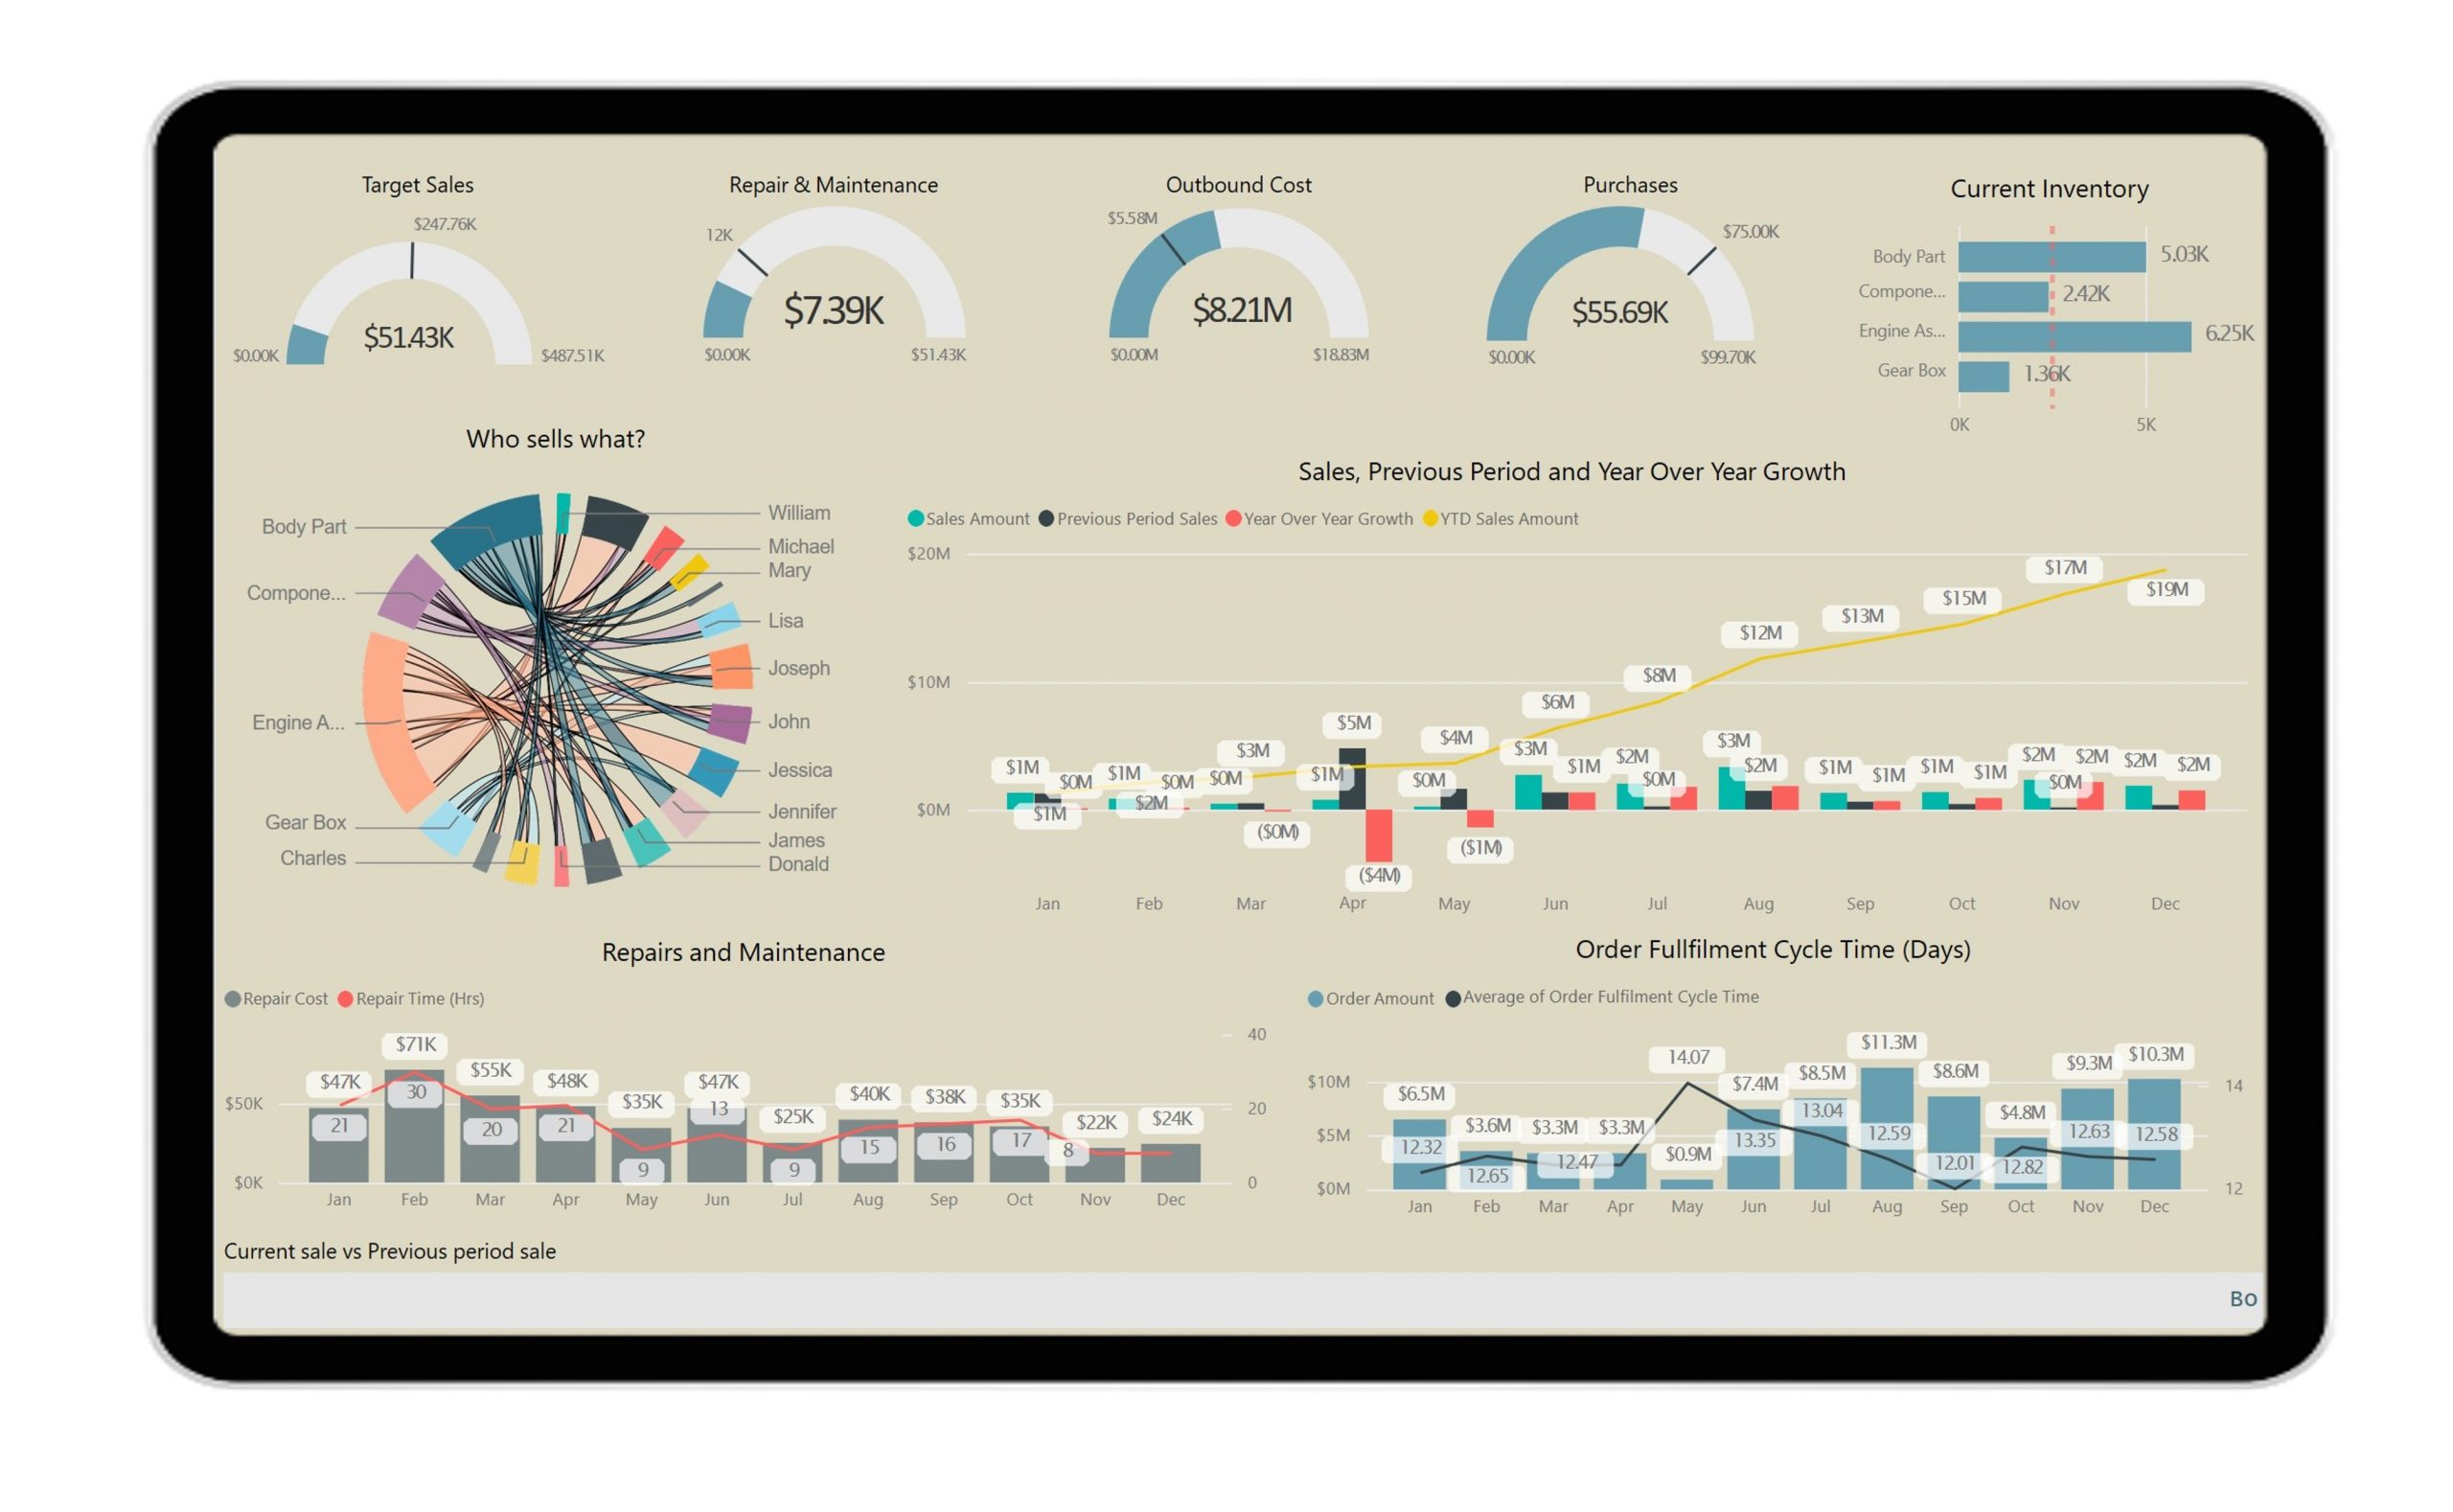
Major Highlights of the Dashboard
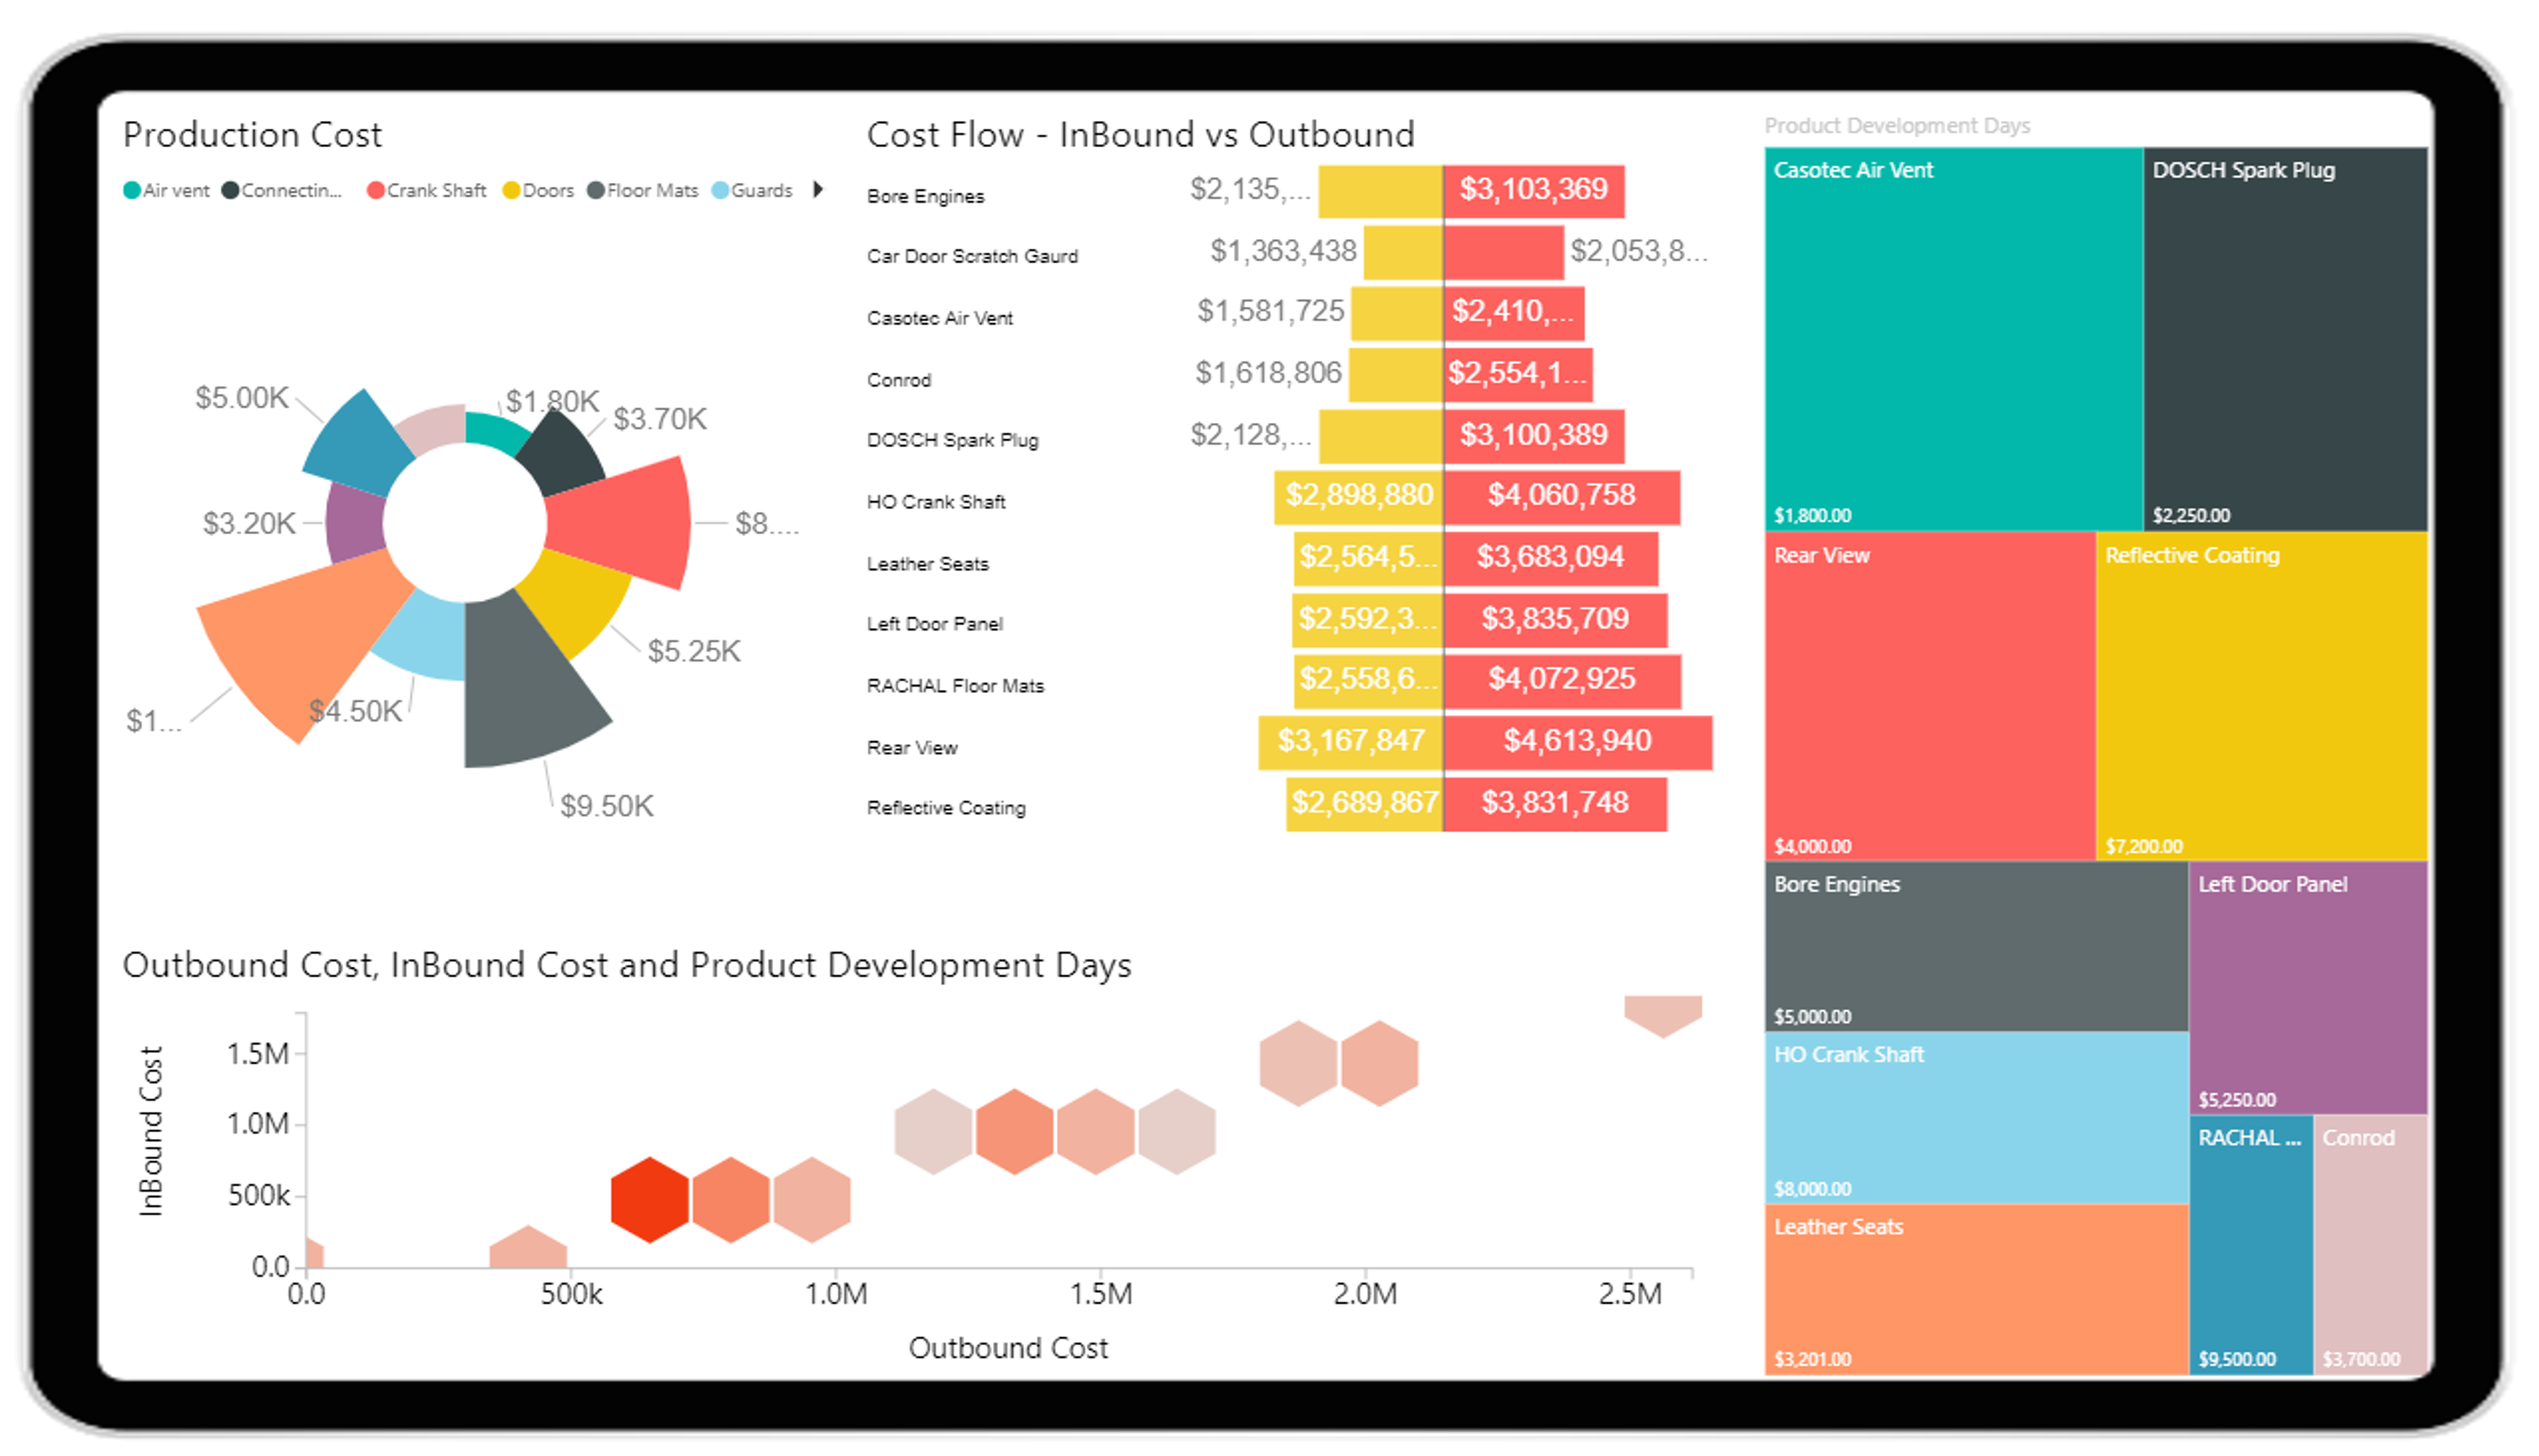
In-depth analysis of annual sales performance tracking-
A)Annual sales numbers with YOY monthly sales growth
B)Top 15-20 customers and business generated through them
C)Number of new customers added in a year, their sales values drilled down to product categories
D)Executive wise sales performances with their major sales order details
E)Geographical distribution of sales
F)Product wise market share
Business Benefits
- 360-degree sales performance analysis with effective visualizations
- Helps in exploring data and analyzing customer/product trends
- Easy to use and effective in finding out best promotions and offers for new customers to grow the business further
- Market share insights helped in understanding the position in the market
Explore More Dashboards
CXO Dashboard
Manufacturing Dashboard
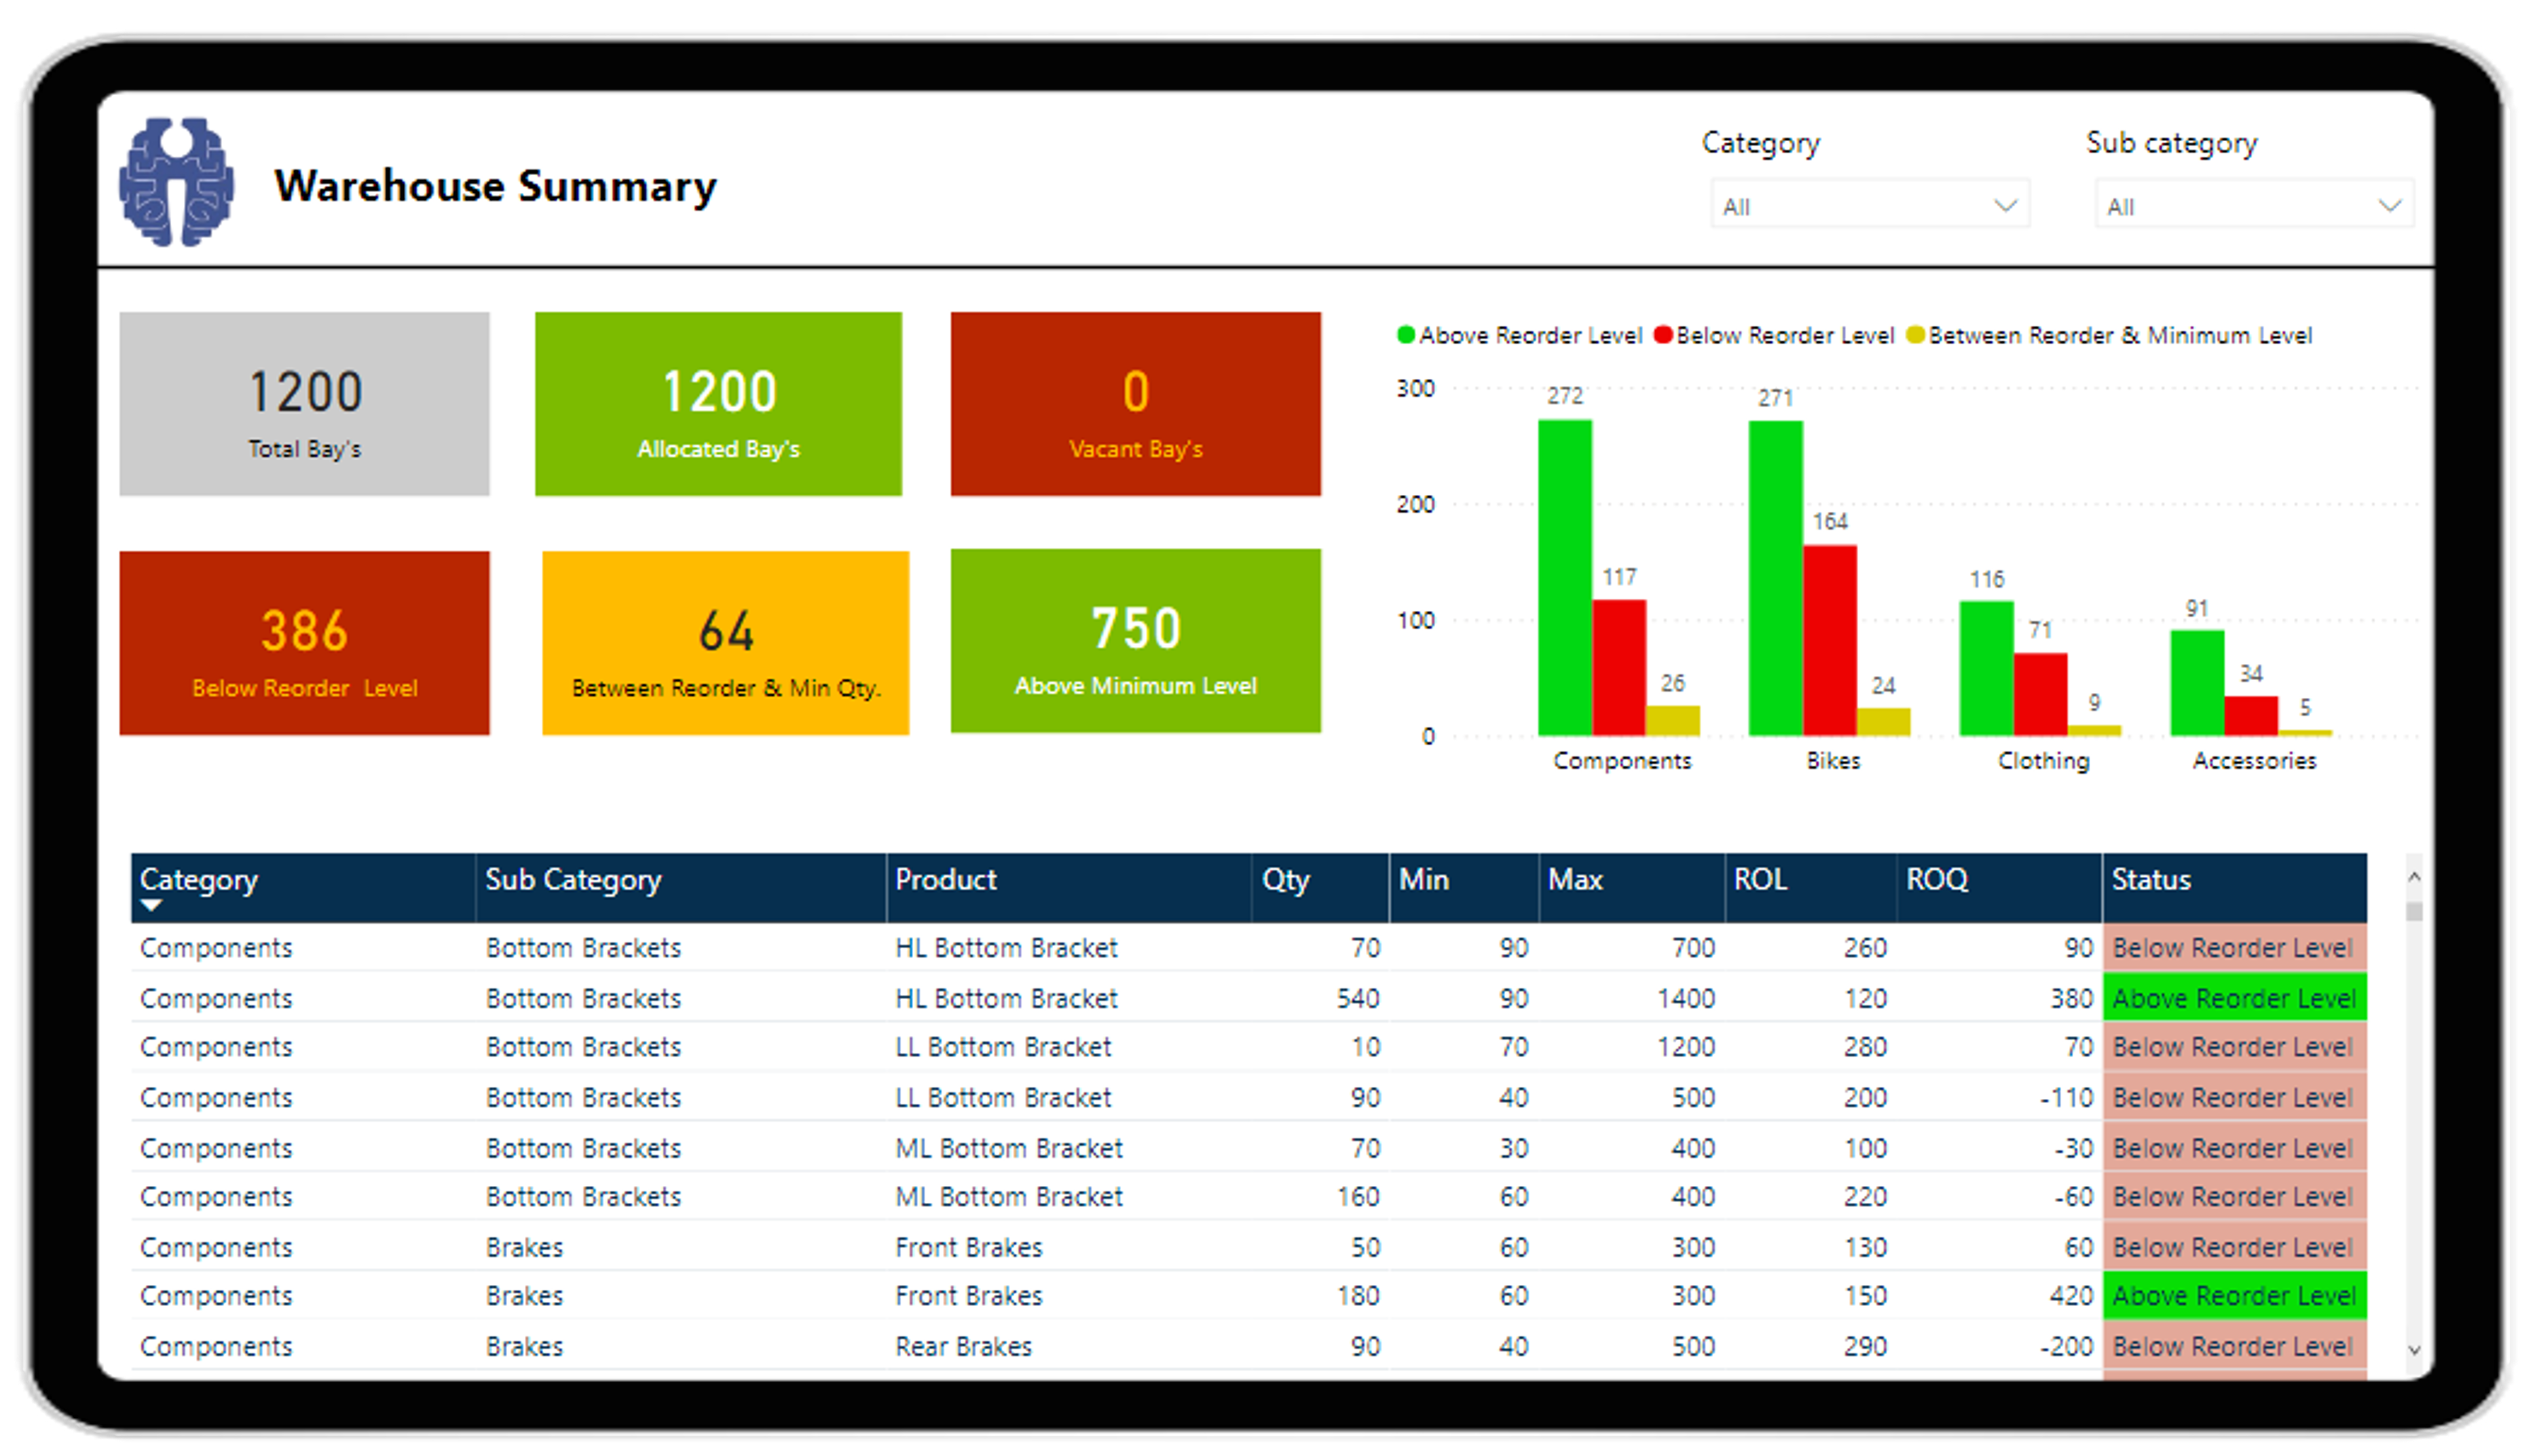
Warehouse Operation Overview
Start your Power BI journey with Intellify Solutions
Book a free demo today