Data Visualization: A Gateway to Informed Decision Making

Quoting Peter Drucker, “If you can’t measure it, you can’t improve it.”
In the world of digitization and big data, the amount of data being generated is ever-increasing, but human perceptual abilities to process and measure the same remain limited.
Yet data analysts are expected to deliver thoroughly analysed outputs and make decisions from the ever-increasing pile of data. Have you ever thought about how it is impacting you? For better understanding, let’s check how the human brain works.
Our brain analyses information best through patterns. According to researchers, the human brain tries to detect patterns in everything to learn quickly.
Visualization of any data helps to break down and process the present data in understandable patterns, thereby making it easier for our brains to analyze the data.
This article is a guide about data visualization as a concept, data visualization tools, and how modern enterprises are leveraging its benefits to scale and grow.
Defining The Problem Statement
Every bit of data has a story to tell, and looking at it unidimensional might create prejudiced thoughts. So, You need to create a narrative to present your story with a multidimensional view. (Ref: How to create a story with your data).
What is data visualization supposed to achieve?
The data produced from everyday processes have certain relationships and patterns. Revealing those patterns is the main idea behind data visualization.
By finding relationships between different data points, one moves towards making informed decisions by providing appropriate insights which lead to a higher chance of success.
Business Intelligence Automation
However, until data analysis remains dependent on unstructured, unplanned, and inconsistent ways, decision-making can never match up to stakeholders’ fast-evolving expectations. Thus, automation in Business Intelligence needs to be adopted on a large scale by Enterprises.
Automated Data Visualization Use Cases 2022
Social Media Data Visualization
Data visualization is the process of taking complicated, diversified datasets and graphically displaying them. Social media data visualization is just the application of this approach to data you collect from social media. According to a McKinsey Global Survey, Only 20% of marketers are truly satisfied with their non-data-driven decision-making. However, with social media data visualization, one can make informed decision-making, and avoid being among the rest.
Business Intelligence Data Visualization
Data visualization for Business Intelligence helps to provide insights from your data which helps your organization move towards Data-driven decision making.
Data Visualization for Psephology
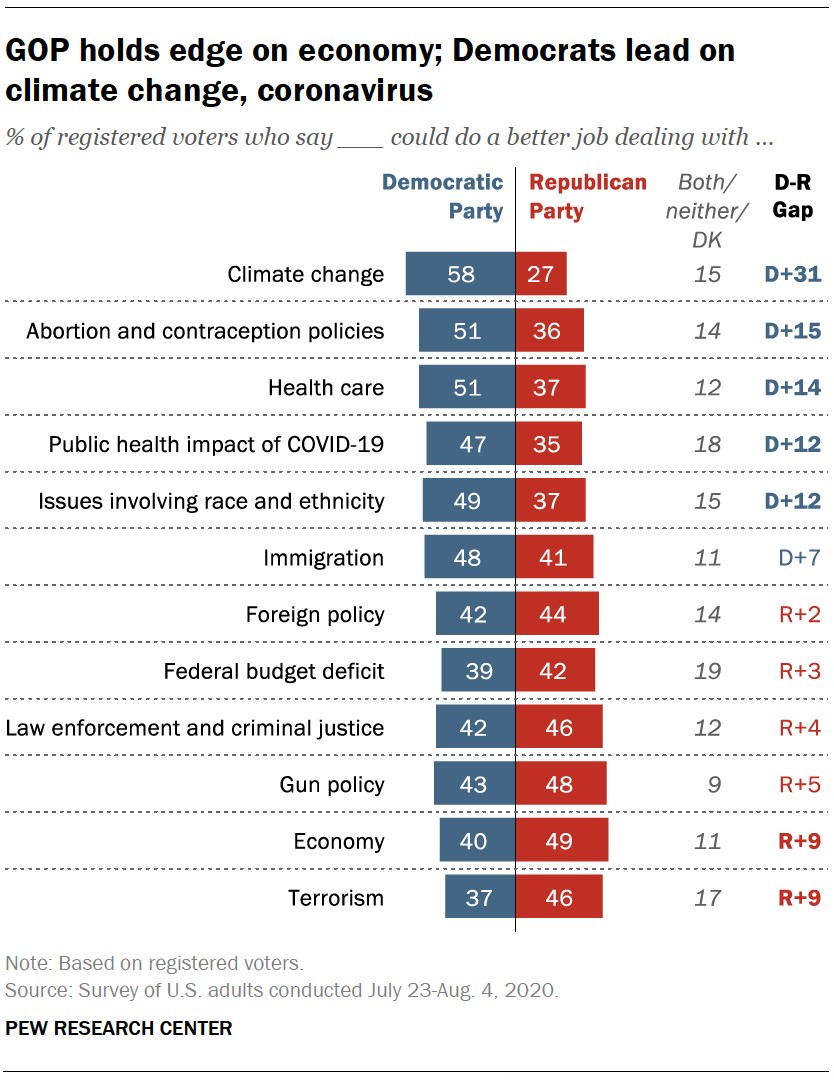
Opinion polls, voting trends and geographic patterns are a few of the many surveys that are conducted during state or national level elections. Below is one such example of a survey from the summer of 2020, three months prior to US Presidential Elections in the same year, that was carried out by Pew Research.

Source: Pew Research
Voters are surveyed about whom they think is the party that will resolve several challenges such as climate change, immigration, economic recovery, healthcare reforms and so on. The Data visualization sheds light on so many issues in a very simplified way.
Data Visualization for Stock Markets
Data visualization is the key in algorithmic trading as it reveals the patterns and helps traders to make buy-sell decisions. Algorithmic trading has evolved and different strategies are being adopted by brokers with the help of visualization. Some of the algorithm trading strategies are – Trend following strategies & Arbitrage opportunities, etc.
Over To You
Only data-driven organizations can rule the commercial sphere in the coming days. Visualizing and interpreting the incoming data quickly is the key to staying ahead of the competition and making wise decisions.
To get started with this endeavor, appropriate context and meaning must be attached to the information.
Further, visualization needs to present data in an understandable and appealing format before analysts to make their job easier.
Intellify offers advanced Data Visualization services tailored to meet the demands of every individual client. We help organizations uncover the insights derived from their data and convert them into an easy-to-navigate dashboard where vital data is accessible to all.
A company that has partnered with the likes of Microsoft for more than seven years now, Intellify is proud to have delivered significant value through its team of consultants having more than 100 years of collective experience.
From upcoming start-ups to Fortune 500 companies, our all-encompassing solutions have helped them all. Business intelligence, Data Analytics, Data Visualization, and Artificial Intelligence are our areas of expertise, and we resolve complex business problems with these services.
To know more about what we do, contact the team at Intellify today.

