Crafting Data Stories Through Expert UX Design
Transforming Complex Data into Compelling Narratives
Simplification is at the core of the products we deliver to our customers. We empower organizations with insightful, simplified, easy-to-comprehend and relate Data Interpretation that drives confident decision making.
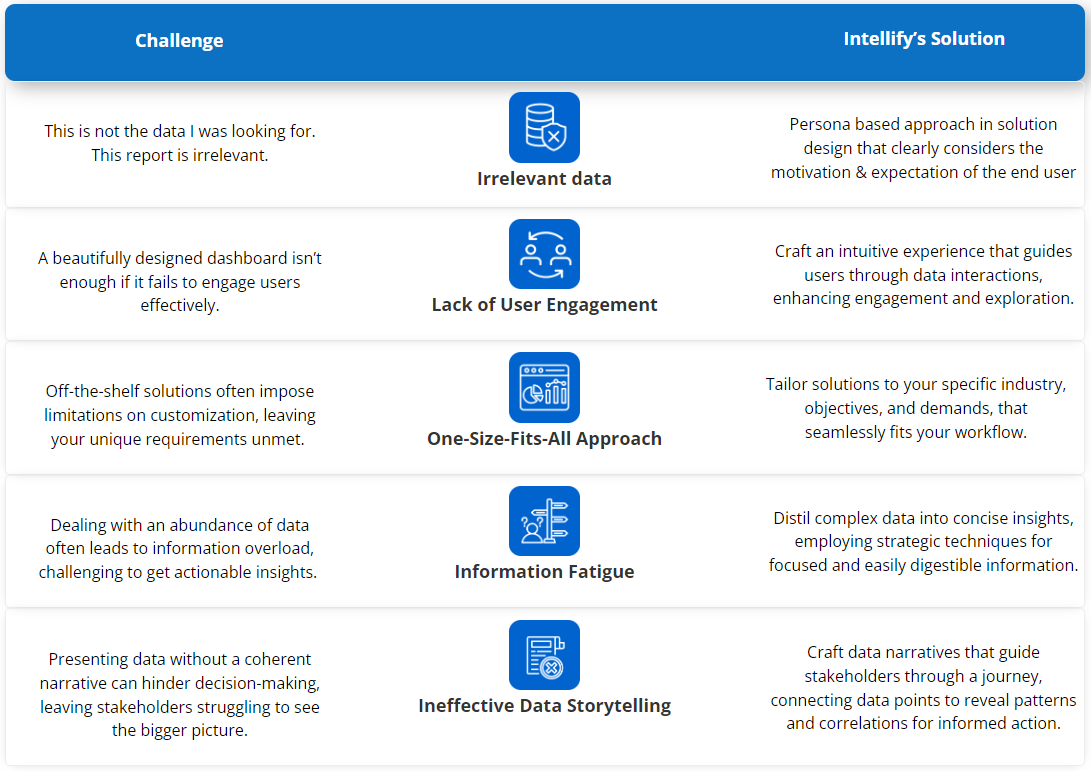
This is how we will help you get over the Decision Maker’s Experience Challenges,
Challenge
Intellify’s Solution
This is not the data I was looking for. This report is irrelevant.

Irrelevant data
Persona based approach in solution design that clearly considers the motivation & expectation of the end user
A beautifully designed dashboard isn’t enough if it fails to engage users effectively.

Lack of User Engagement
Craft an intuitive experience that guides users through data interactions, enhancing engagement and exploration.
Off-the-shelf solutions often impose limitations on customization, leaving your unique requirements unmet.

One-Size-Fits-All Approach
Tailor solutions to your specific industry, objectives, and demands, that seamlessly fits your workflow.
Dealing with an abundance of data often leads to information overload, challenging to get actionable insights.

Information Fatigue
Distil complex data into concise insights, employing strategic techniques for focused and easily digestible information.
Presenting data without a coherent narrative can hinder decision-making, leaving stakeholders struggling to see the bigger picture.

Ineffective Data Storytelling
Craft data narratives that guide stakeholders through a journey, connecting data points to reveal patterns and correlations for informed action.
This is how we will help you get over the Decision Maker’s Experience Challenges,
Schedule time with Intellify Experts to know more
Our Approach
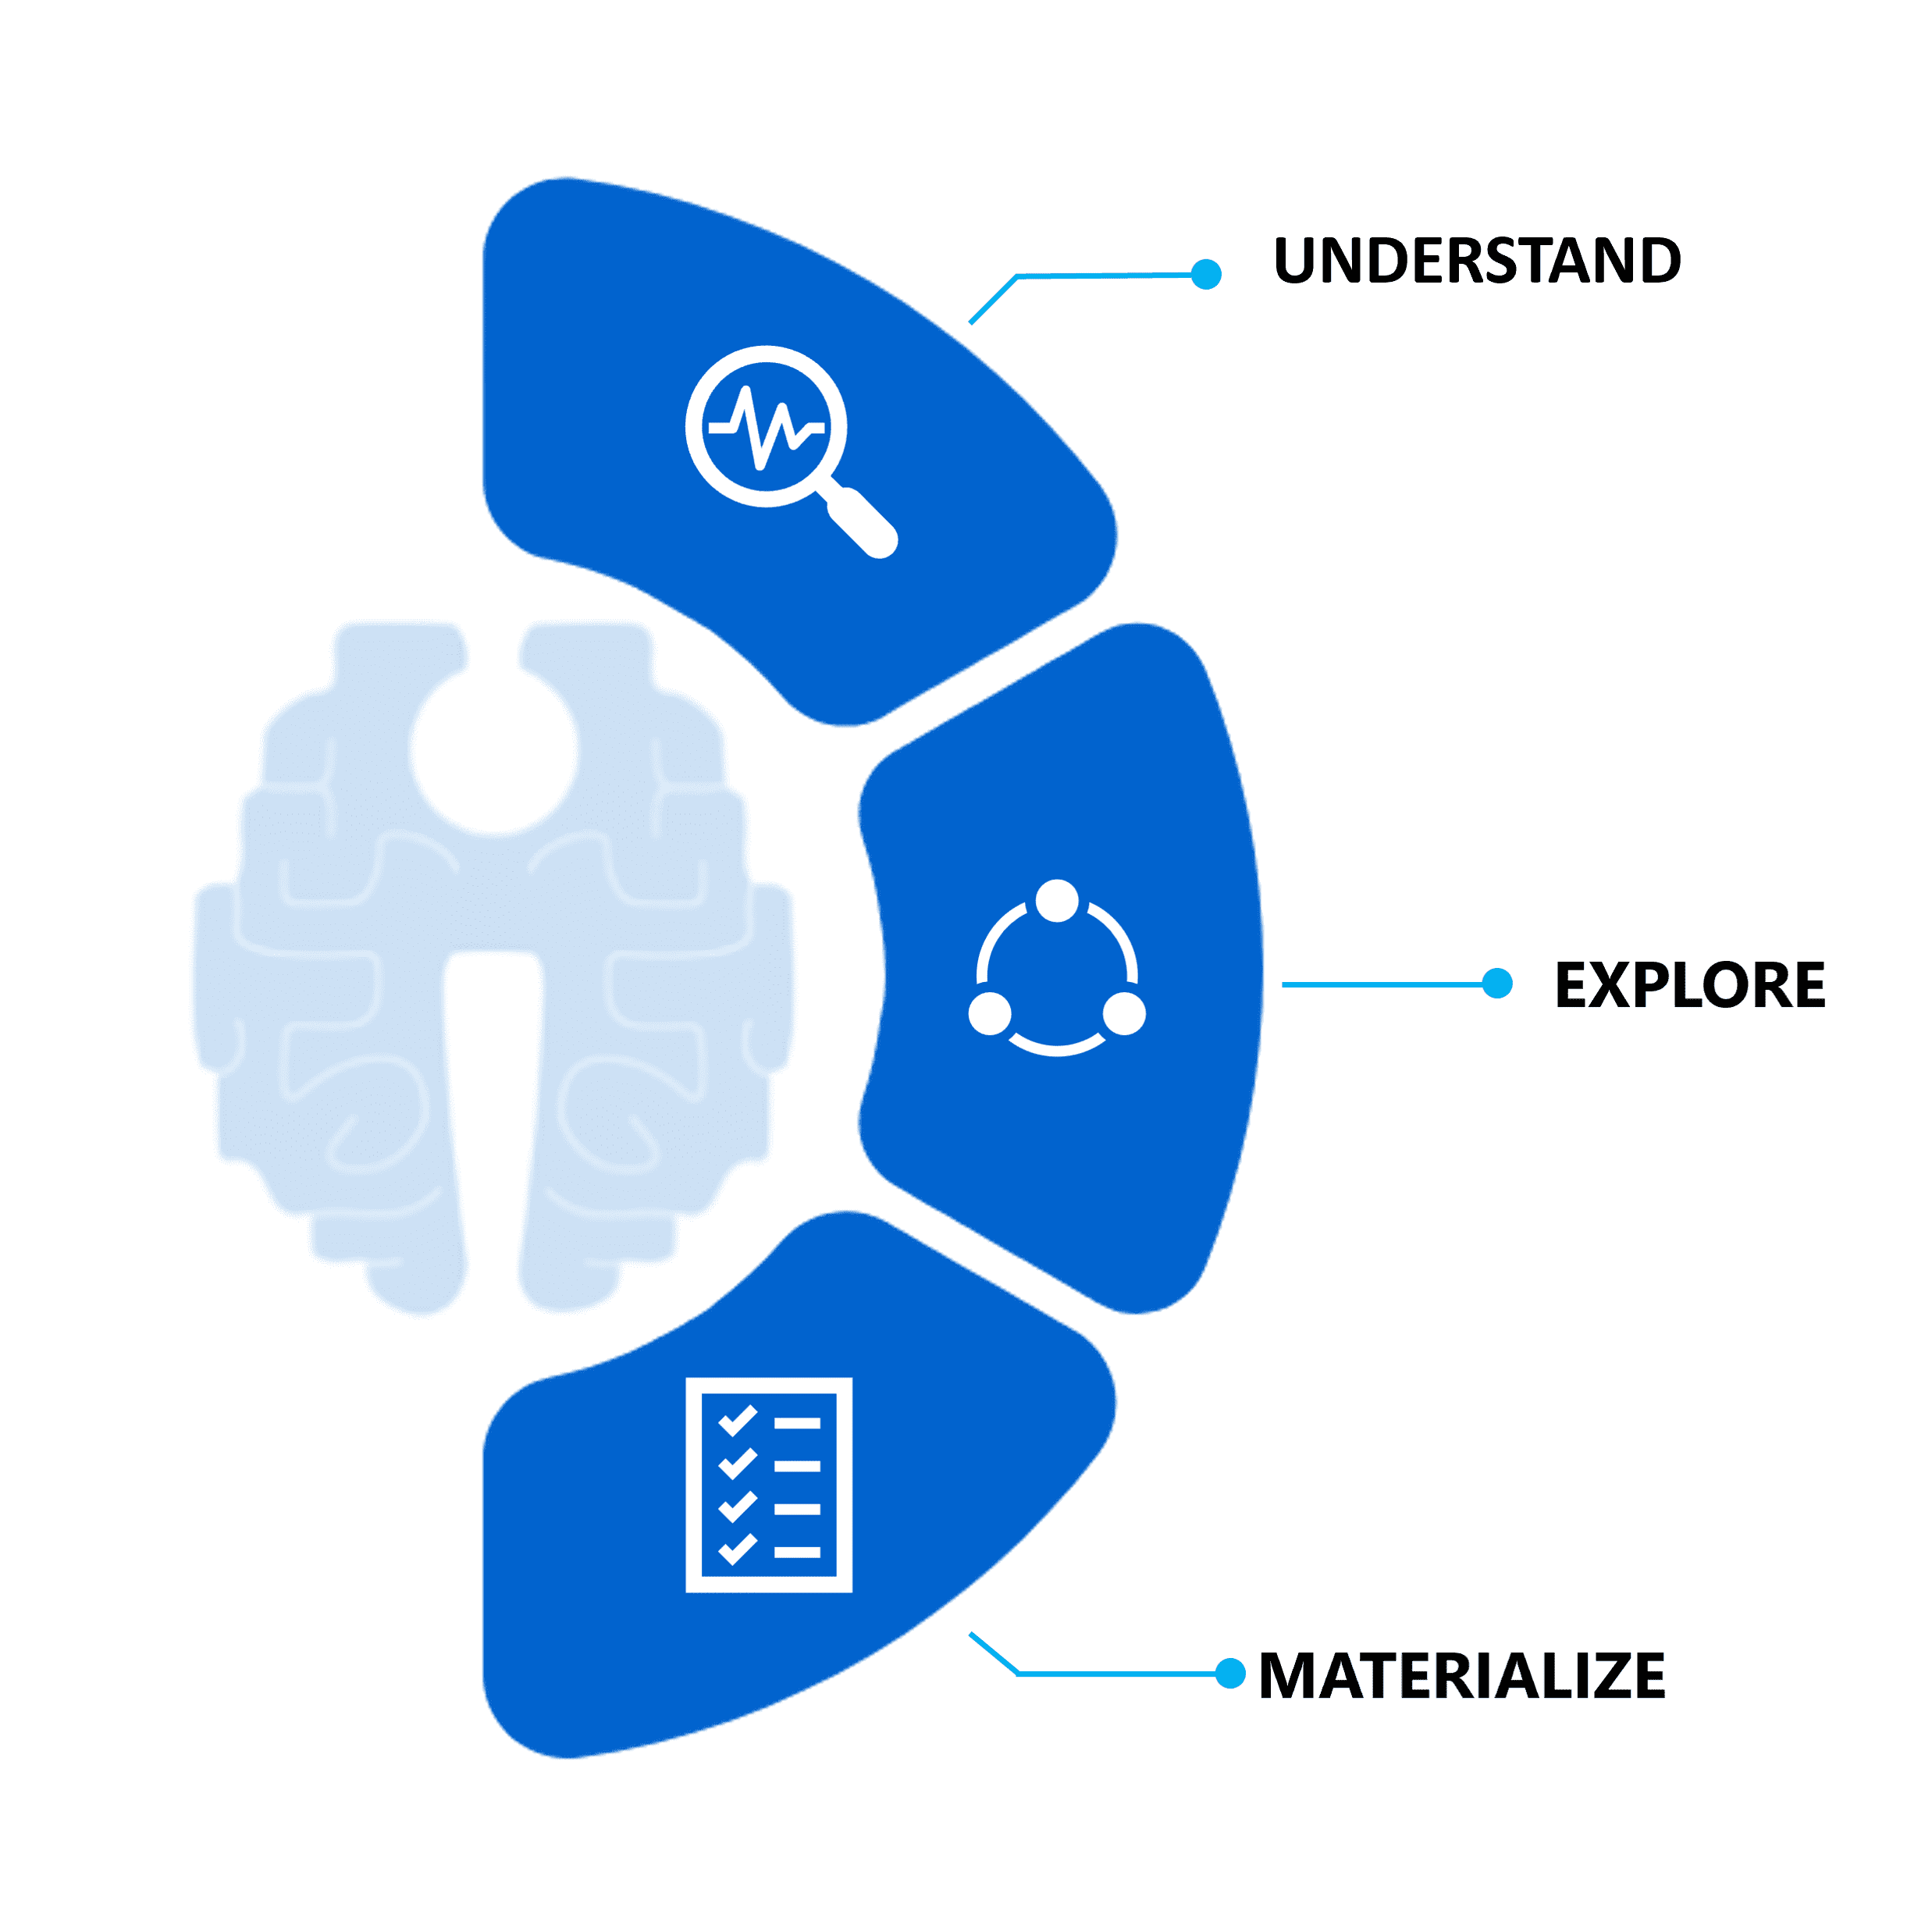
Understand
1. Who is/are your Audience?
2. What are the problems to solve?
3. How should be the consumption Experience?
4. Analysing additional Requirements
Explore
5. Sketching the Data Story
6. Effective Data Visualization
7. DAX
8. Power BI Features & Capabilties set up
9. Branding
10. Color themes
Materialize
11. Test
12. Deployment
Case Studies

Power BI solution for a leading manufacturing company

Microsoft BI solution for leading African Bank

