by Intellify | Mar 29, 2022 | Blog, Power BI
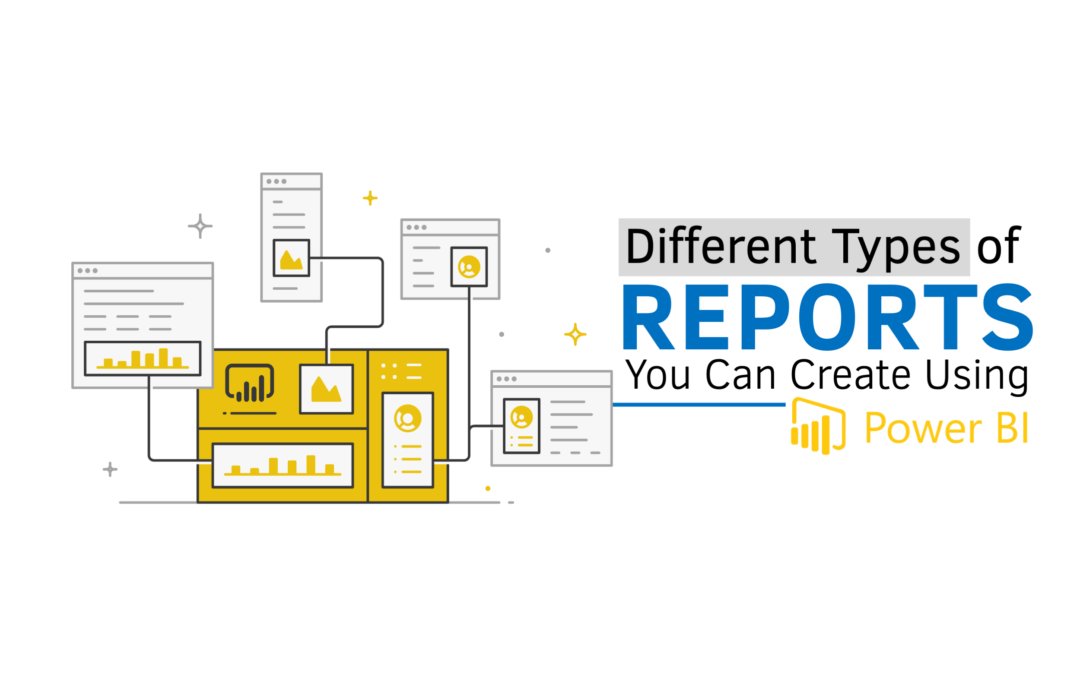
Different Types of Reports You Can Create Using Power BI To be successful in today’s digital age, one must have access to a wealth of data. Data visualisation and Business Intelligence are not new concepts. Every day, new and more dynamic business intelligence...
by Intellify | Mar 22, 2022 | Azure, Blog
Understanding Azure Synapse Analytics What is Azure Synapse Analytics? Image Source : Microsoft Azure Data Warehouse is the central repository of integrated data from one or more disparate data sources aggregated as per business needs which is later used for reporting...
by Intellify | Mar 8, 2022 | Blog, Business Intelligence
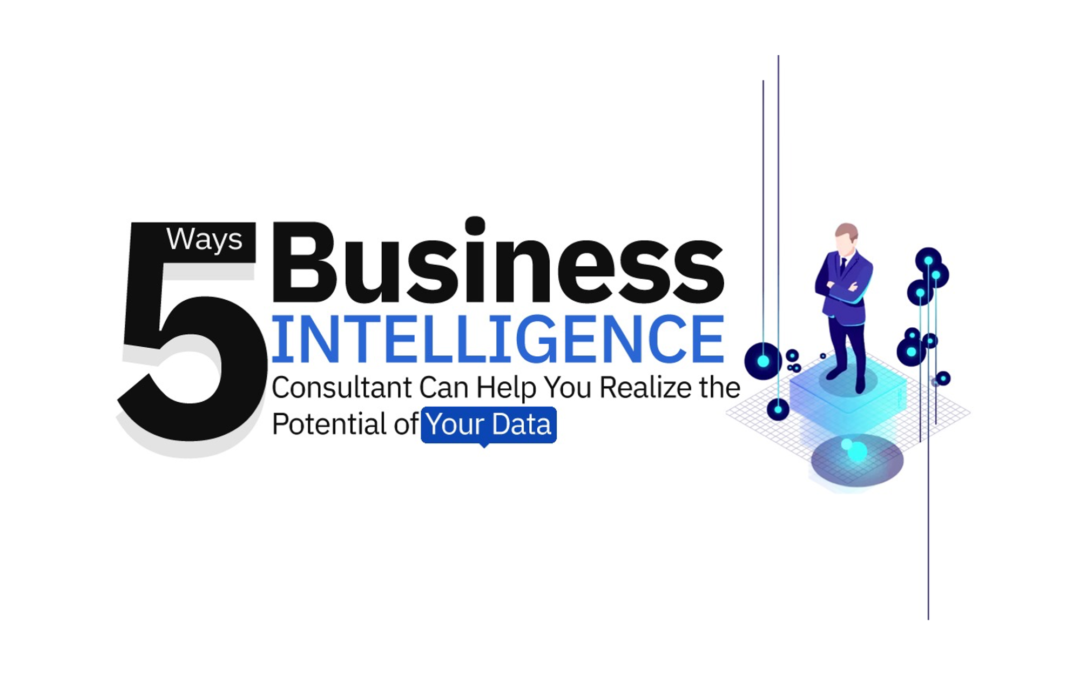
5 Ways Business Intelligence Consultant Can Help You Realize the Potential of Your Data We live in the era of Big Data (with volume, variety and velocity), where massive information overloads are being thrown at us every day. While most organizations, in the...

by Intellify | Mar 2, 2022 | Blog, Power BI
What’s The Better Choice: Power BI or Tableau? Power BI and Tableau- Overview Microsoft Power BI is a cloud-based service with integrated business analytics and visualization services. It allows the user to gather, analyze and visualize the data with interactive...

by Intellify | Feb 22, 2022 | Blog, BOT, Data Visualization, data-visualization-gallery
Data Visualization: A Gateway to Informed Decision Making Quoting Peter Drucker, “If you can’t measure it, you can’t improve it.” In the world of digitization and big data, the amount of data being generated is ever-increasing, but human perceptual abilities to...
by Intellify | Feb 14, 2022 | Blog, Data Visualization, data-visualization-gallery
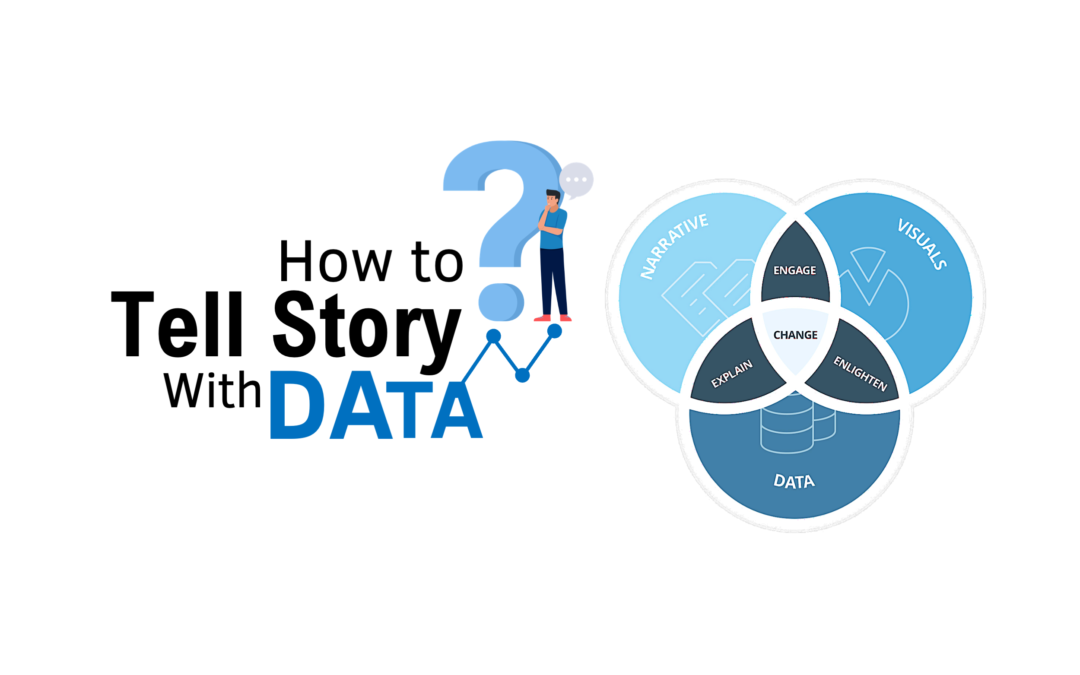
How to Design Story with Data? As we all know – when we tell story along with facts and figures, its more meaningful. Somewhere I had read – We believe in god but trust in Data. As per Brent Dykes author of “Effective Data Storytelling”, there are three pillars of...
