What’s The Better Choice: Power BI or Tableau?

Power BI and Tableau- Overview
Microsoft Power BI is a cloud-based service with integrated business analytics and visualization services. It allows the user to gather, analyze and visualize the data with interactive dashboards in a very short span of time. Power BI helps to enrich and transform the data into any desired format and put it to use.
Tableau is a very powerful data visualization tool used in the business intelligence industry. It allows transforming raw data into user-friendly formats. Data analysis is fast and the visualizations are in the form of spreadsheets and dashboards.
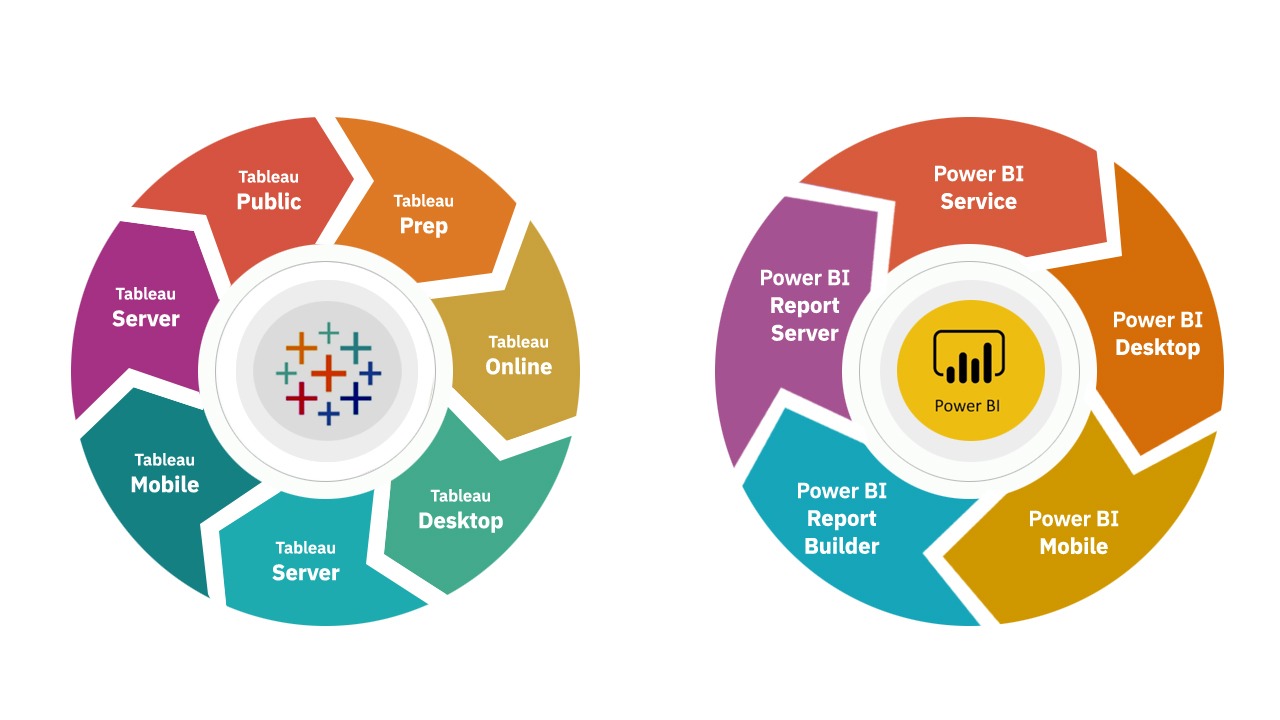
Product Family

Features of Tableau & Power BI
Tableau |
Power BI |
| No / Types of Visualizations | |
| A Tableau user can use 24 different types of visualization | Power BI offers more than 3500 data points for drilling down the dataset for better data visualization |
| Customer Support | |
| Tableau has excellent customer support services Although it depends on the license you opted. | Power BI free edition offers limited customer support. Paid editions have unlimited and fast customer support services |
| Developer Technical competency: High vs Low | |
| Mostly it is used by experienced analysts for data visualization | People with all kinds of experience levels can utilize Power BI resources |
| Equal concentration is given to data storage | Concentration is more on data analysis and modeling |
| Some experience is required with data visualization and analysis to learn Tableau. Its interface can be classified as intelligent | The user interface is friendly and can be learned by everyone easily. It has an intuitive interface that can be integrated with other Microsoft products |
| Language Support | |
| Tableau uses VizQL | Uses DAX and M language |
| Supported Data Sources | |
| Can connect to 90+ data sources from the very beginning – (List of connectors here) | Ever-growing list of 150+ data connectors of different data sources increasing on monthly basis. (List of connectors here) |
| Embedding | |
| Tableau reports embedding in custom applications is possible with support of Row Level Security (RLS). | Power BI reports embedding is possible in multiple ways (AD Authentication and Forms Authentication) with Row Level Security (RLS) |
| ML / AI Integration | |
| Tableau can be easily integrated with R and Python for Predictive and Artificial Intelligence. | Connecting Power BI with R programming language is available only with enterprise-level users. |
| Licensing Model | |
| To view the reports in Tableau, user need to opt for Tableau Viewer subscription. | Viewing and Interacting with Power BI reports is free with Power BI Desktop. |
| Learning Curve | |
| Tableau requires expertise to build dashboards. | Power BI can be used by people who have used Excel |
Power BI Products –
- Power BI Desktop: Power BI Desktop lets you turn your data into dynamic, interactive stories that look amazing and are easy to understand, at your fingertip on desktop.
- Power BI Service: Power BI services is the SaaS (Software as a Service) part of Power BI. In this, Dashboards and reports connect to datasets that bring all of the relevant data together in one place.
- Power BI Mobile: Power BI mobile lets you take your Power BI reports on the road. Access your reports on your mobile devices from anywhere and anytime.
- Power BI report builder: A tool within the platform you can use to author paginated reports that you create with your data
- Power BI report server: A Cloud-ready on-premises report server with ability to confidently scale to thousands of users at a same time.
Key Features of Power BI –
- SaaS solutions available with pre-built dashboards and reports
- Real-time dashboard updates are available
- Provides reliable and secure data source connections in the cloud or on-premises model
- Capable to implement row level security funtions
- Integration with Microsoft 365 suite products with new features added frequently
- Artificial Intelligence and Machine Learning is supported in the Power BI Premium environment.
Tableau Products –
- Tableau Prep: Which provides a visually attractive and direct way to shape, combine and clean the data. Also helps automating data prep flows, which ultimately helps getting analysis and insights faster.
- Tableau Desktop: Where user can explore the data with an intuitive interface, encouraging curiosity, creativity, and data-driven decision-making. It helps building visualizations with drag and drop functionalities, employ AI-driven statistical modeling with a click, and even ask questions using natural language.
- Tableau Online: Which is hosted on the cloud and helps publish dashboards and share with anyone. User can invite external users to explore the hidden insights from the interactive visualizations and accurate data.
- Tableau Server: A Cloud-ready on-premises report server with ability to confidently scale to hundreds of users at a same time.
- Tableau Mobile: With Tableau mobile app user access and monitor the KPI’s and dashboards shared with him/her on the go.
Key features of Tableau –
- Large datasets can be handled seamlessly
- Pre-selected filter values can be saved for future use
- Enhanced data visualization functions
- Mobile-ready dashboards
- Querying in natural language with ‘Ask Data’
The Intellify Advantage
Each tool has its own Pros and Cons depending on your requirements and how you explore features & functionalities to build Reports and Dashboards. Choosing the right tool requires experts consulting and deep industry experience which Intellify has built over 100+ years collective experience in Business Intelligence and Data Analytics.
Intellify team can help you with choosing the right tool for your requirements and work with you to conduct the Proof of Concept (PoC). Intellify has developed story building with data templates which expedite the Business Intelligence implementation process.
Why Choose Intellify
- Certified development team from Power BI and Tableau
- 100+ years of collective experience in data architecture and dashboarding solutions
- Experience working with multiple Domains and has success stories for Banks, Lending , Manufacturing, Biotechnology and more.
- Flexible development and execution models model: Fixed Fees, Time & Material, Hybrid, On-site, Offshore Hybrid model, PoC’s etc.
- Partnership with Microsoft, Tableau in Progress
- Experience working on big data models containing millions of records from different real-time and other data sources and 100+ tables and data dimensions
- We have built off the shelf & ready to use accelerators from multiple domains and industries to get a head start on our BI journey
Let’s connect to explore and build one more success story together.
