by Intellify | Mar 8, 2022 | Blog, Business Intelligence
5 Ways Business Intelligence Consultant Can Help You Realize the Potential of Your Data We live in the era of Big Data (with volume, variety and velocity), where massive information overloads are being thrown at us every day. While most organizations, in the...

by Intellify | Mar 2, 2022 | Blog, Power BI
What’s The Better Choice: Power BI or Tableau? Power BI and Tableau- Overview Microsoft Power BI is a cloud-based service with integrated business analytics and visualization services. It allows the user to gather, analyze and visualize the data with interactive...

by Intellify | Feb 22, 2022 | Blog, BOT, Data Visualization, data-visualization-gallery
Data Visualization: A Gateway to Informed Decision Making Quoting Peter Drucker, “If you can’t measure it, you can’t improve it.” In the world of digitization and big data, the amount of data being generated is ever-increasing, but human perceptual abilities to...
by Intellify | Feb 14, 2022 | Blog, Data Visualization, data-visualization-gallery
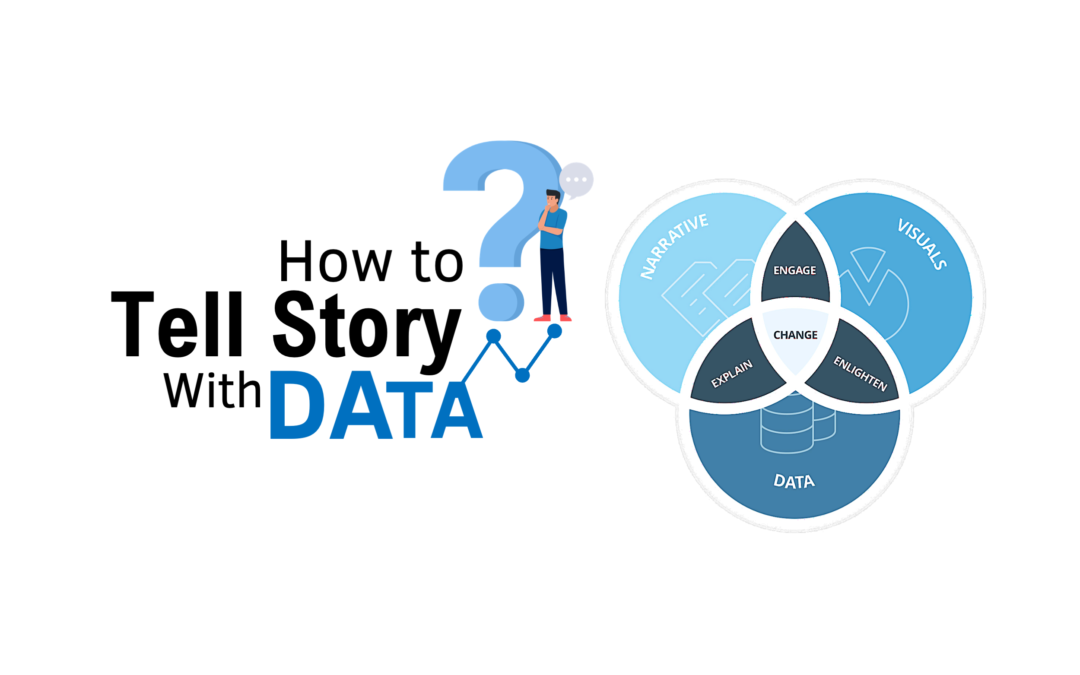
How to Design Story with Data? As we all know – when we tell story along with facts and figures, its more meaningful. Somewhere I had read – We believe in god but trust in Data. As per Brent Dykes author of “Effective Data Storytelling”, there are three pillars of...
by Intellify | Feb 7, 2022 | Blog, Power BI
How Power BI KPI (Key Performance Indicators) is Helping Businesses? Key Performance Indicators (KPIs) are quantifiable measure that helps to determine how well the company goals are being met. Whether you are a small enterprise or a large MNC, all businesses need to...
by Intellify | Feb 4, 2022 | Blog, Data Visualization
Data visualization : Decision Making Enabler In the age of big data, 72% of businesses are currently collecting the data they will never be able to use. But that doesn’t mean that the data is not useful. It only means that data is not being used properly. Companies...
