
Our Blog
Our thoughts, learnings. predictions, and everything
related to technology at one place!
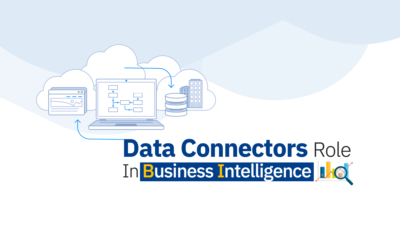
Data Connectors Role in Business Intelligence
With the rapid increase in technology adoption, Software-As-A-Service (SaaS) space has rapidly evolved too. There are software solutions for almost everything. While this is a major positive for enterprises, the major downside is the data is with SaaS application...
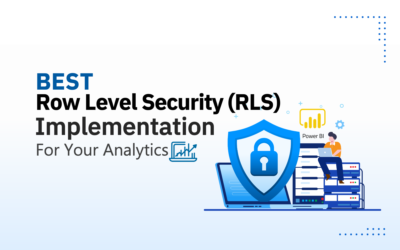
Best Row Level Security (RLS) Implementation For Your Analytics
Row Level Security is an important part of an organization‘s security policy. You need to ensure that each user has proper data visibility by adopting the RLS. Without RLS, report consumers may get access to data they should not, such as finance or sales data,...
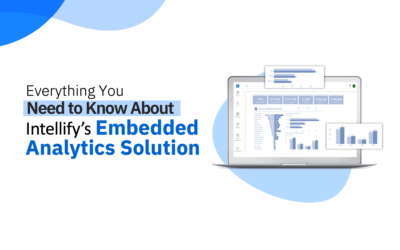
Everything You Need To Know About Intellify’s Embedded Analytics Solution
Data and the way it is presented, tells a unique story. Each statistics or data point has a story to tell. For example, a firm’s revenue is ten times more than the previous year means there is a story of Growth and transformation. When it is presented at a point of...
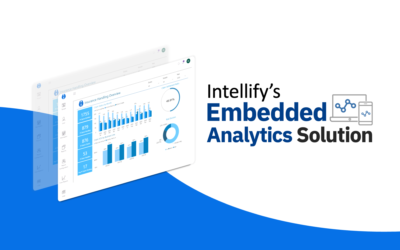
Intellify’s Embedded Analytics Solution
Embedded analytics with the integration of analytical capabilities and data visualisations at point of need, i.e. product, portal, website or custom web application, without the need to switch between different applications, closes the last mile of BI. As per research...
Why Modernize Your Application with Embedded Analytics?
The emerging trends and use cases of embedded analytics consistently keep the buzz around. And why not? As Embedded Analytics can increase the value of your product by 43% and enabling you to charge 25% more than your current product pricing. A research study shows...
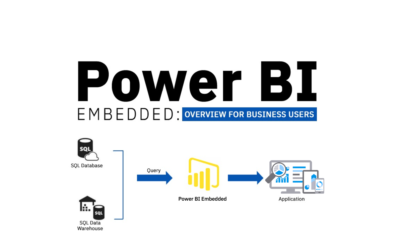
Power BI Embedded: Overview for Business Users
“For maximum utilization of tool or feature – it needs to be at right place with right presentation. As we all know Visualizing data using different charts and colours, makes it interesting and easy to understand different trends. Now when it comes to embedding these...
Everything you need to know about Power Apps Portal
Low code/no code point has changed the entire way to look at the complexity of Application Development. Programming processes that web or software developers used are now evolved and transformed into drag-drop functionalities. This level of simplicity emerged and...
Is Microsoft Power Apps Right Choice for Your Organization?
With the constantly changing Business Processes, Organizations need tools to quickly adapt to the changes and get the business rolling with highest priority. To tweak existing process or create new business processes - custom software development takes time and needs...
10 Brilliant Use Cases of Power Apps
Businesses need to adapt to a new form of technological and digital advancements to grow their organization in a lean way. Organizations today use the power of data to enable informed decision making to remain ahead of time. Being a part of powerful Microsoft...