
Our Blog
Our thoughts, learnings. predictions, and everything
related to technology at one place!
What’s The Better Choice: Power BI or Tableau?
Power BI and Tableau- Overview Microsoft Power BI is a cloud-based service with integrated business analytics and visualization services. It allows the user to gather, analyze and visualize the data with interactive dashboards in a very short span of time. Power BI...
Data Visualization: A Gateway to Informed Decision Making
Quoting Peter Drucker, "If you can’t measure it, you can’t improve it.” In the world of digitization and big data, the amount of data being generated is ever-increasing, but human perceptual abilities to process and measure the same remain limited. Yet data analysts...
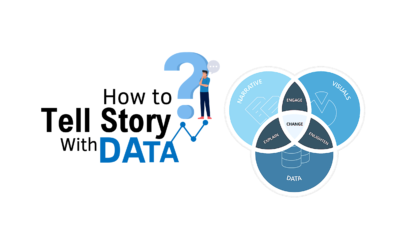
How to Design Story with Data?
As we all know – when we tell story along with facts and figures, its more meaningful. Somewhere I had read – We believe in god but trust in Data. As per Brent Dykes author of “Effective Data Storytelling”, there are three pillars of effective Data Storytelling, viz...
How Power BI KPI is Helping Businesses?
Key Performance Indicators (KPIs) are quantifiable measure that helps to determine how well the company goals are being met. Whether you are a small enterprise or a large MNC, all businesses need to record the progress the firm has made and make decisions based on the...
Data visualization; Decision Making Enabler
In the age of big data, 72% of businesses are currently collecting the data they will never be able to use. But that doesn’t mean that the data is not useful. It only means that data is not being used properly. Companies today are collecting data; data sets that are...
Why is data visualization important for business?
A well-known proverb, ‘A picture is worth thousand words’ is well suitable for the Data Visualizations as it can visualize the thousands of data records in the single chart which told us the story on-behalf of the larger amount of data. But why we find visualizations...
A Guide to create Data Driven Organizations
Data management and analysis is some of the most important aspects for businesses in today’s time. Most organizations, especially large enterprises, are investing resources in collecting, storing, securing, and analysing their data. But why such serious focus on data?...
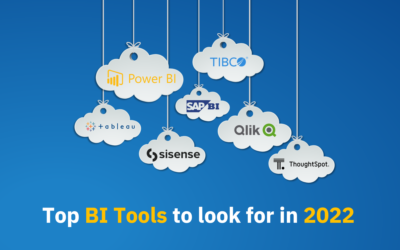
Top BI tools to look for in 2022
Have you ever felt like swamped up with data and it’s not helping you make decisions? And with each passing year, the vast volume of data being created create challenge to all organizations of all kinds. Ultimately, organizations and businesses need appropriate...
Best Data Visualization tools to explore for your reporting needs
In this age of data and modern-day technology, it is crucial to have capable tools to help your business reach its full potential. It is also extremely important to have a good knowledge of representing the data in correct manner to make it easy to consume and...