Intellify Solutions
  • Services
    • Modern Data Platform
      • Assessment
      • Implementation
      • Governance & Security
      • Synapse Analytics
      • Microsoft Fabric
      • Microsoft Fabric Migration Factory
    • Data Services
      • Data Analytics
      • Data Engineering
    • Visualization Services
      • Power BI
      • Advance Analytics
      • Reporting UX
      • Reporting Factory
    • Generative AI
    • Low Code/No Code
      • Power Apps
      • Power Automate
    • Application Development
  • Solutions
    • Analytics Accelerators
    • Lending Analytics
    • Financial Analytics
    • HR Analytics
    • Embedded Analytics
    • Microsoft Fabric Migration Factory
  • Workshops
  • Learn
    • Case Studies
    • Blog
    • White Papers
  • Company
    • About Us
    • Leadership
    • Our Team
    • News and Events
    • Careers
    • Contact Us
  • Contact Us
Select Page
The Analytics Maturity Model: Discovering Your Company’s Data Capabilities

The Analytics Maturity Model: Discovering Your Company’s Data Capabilities

by Intellify | Apr 4, 2023 | Blog, Data Analytics

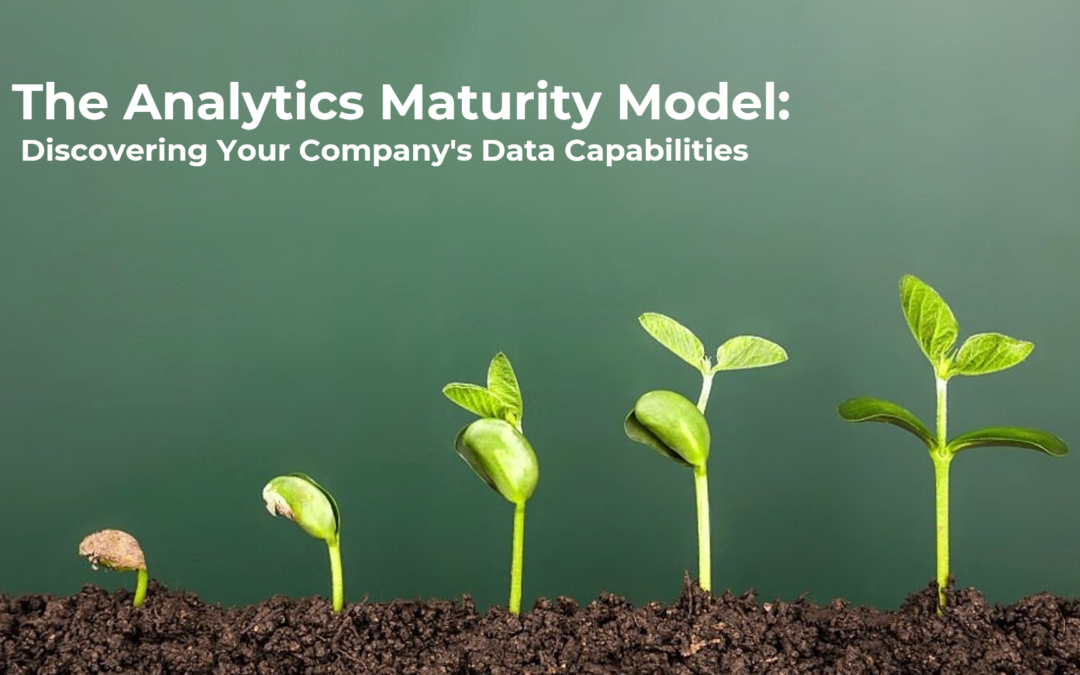
The Analytics Maturity Model: Discovering Your Company's Data Capabilities As we all know, there are different stages of analytics, and every organization must be at certain stage. To know what your organization’s maturity on analytics – one needs to know the...
5 Ways Business Intelligence Consultant Can Help You realize the Potential of Your Data

5 Ways Business Intelligence Consultant Can Help You realize the Potential of Your Data

by Intellify | Mar 8, 2022 | Blog, Business Intelligence

5 Ways Business Intelligence Consultant Can Help You Realize the Potential of Your Data We live in the era of Big Data (with volume, variety and velocity), where massive information overloads are being thrown at us every day. While most organizations, in the...
How to Design Story with Data?

How to Design Story with Data?

by Intellify | Feb 14, 2022 | Blog, Data Visualization, data-visualization-gallery

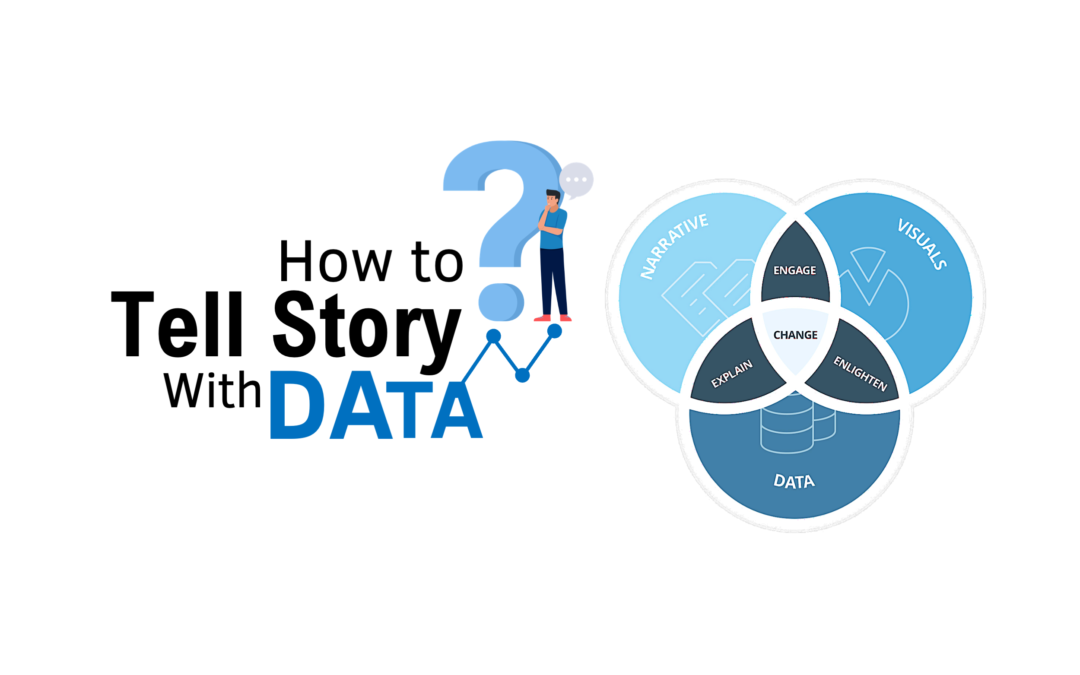
How to Design Story with Data? As we all know – when we tell story along with facts and figures, its more meaningful. Somewhere I had read – We believe in god but trust in Data. As per Brent Dykes author of “Effective Data Storytelling”, there are three pillars of...
DASHBOARDS AND VISUALIZATIONS ARE THE TIP OF THE ICEBERG

DASHBOARDS AND VISUALIZATIONS ARE THE TIP OF THE ICEBERG

by Intellify | Feb 12, 2019 | Business Intelligence, Data Visualization

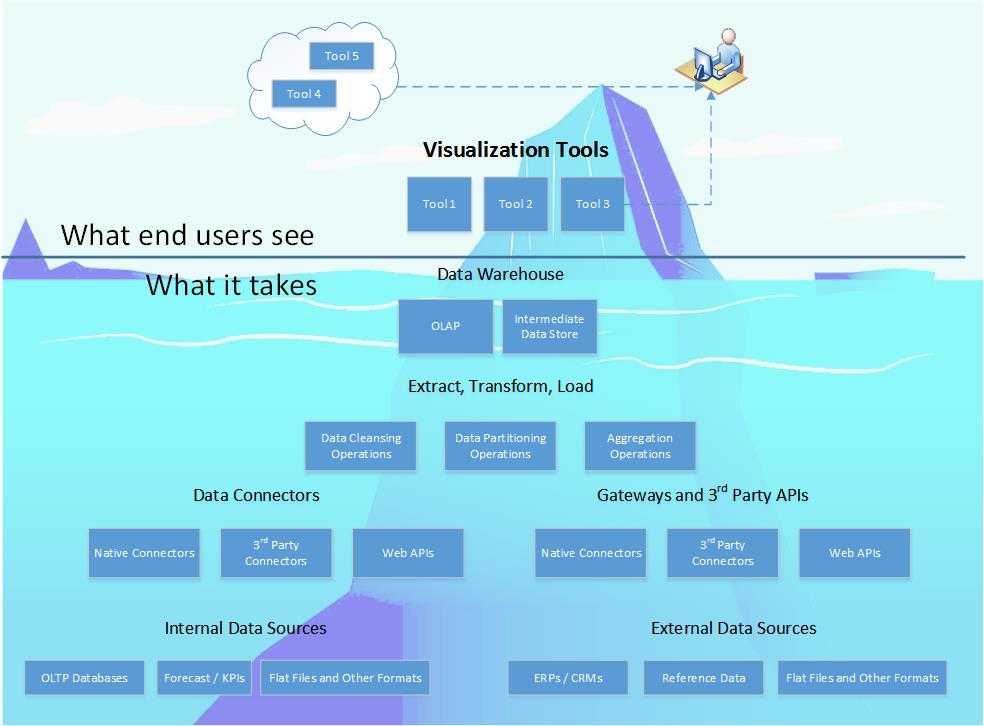
Dashboards And Visualizations Are The Tip of The Iceberg Rapid developments in Business Intelligence have resulted in decision makers and BI practitioners engage with new tools for insightful visualizations. The desired objectives are achieved only after in-depth...

Services

  • Business Intelligence
  • Data Analytics
  • Data Visualization
  • Artificial Intelligence
  • Microsoft Fabric
  • Power BI Services
  • Power Apps
  • Power Automate
  • Product Development
IntellifyCertificate-MSFTLogo (1)

Solutions

  • Lending Analytics
  • Financial Analytics
  • HR Analytics
  • Embedded Analytics

Quick Links

  • About Intellify
  • Blog
  • Careers
  • Contact Us
  • News & Events

Contact

USA :
Office 1: 9 E Loockerman St, Ste 202, Dover, Delaware, 19901,
+1 425 818 9949 

Office 2: 1201 3rd Ave #2200, Seattle, WA 98101

+1 302 240 4302 

India : B1302, Amar Business Zone, Swati Park, Veerbhadra Nagar, Baner, Pune, India-411045

+91 992 296 8725

contact@intellifysolutions.com

 Twitter

Copyright 2025 Intellify Solutions | All Right Reserved. | View Sitemap