
Gap Analysis Winning Margin
What is Gap Analysis?
We keep talking about Gap Analysis and its benefits. It helps us understand data better when we do gap analysis of winners & Losers, Actual & Target and many other.
Visualization for Gap Analysis
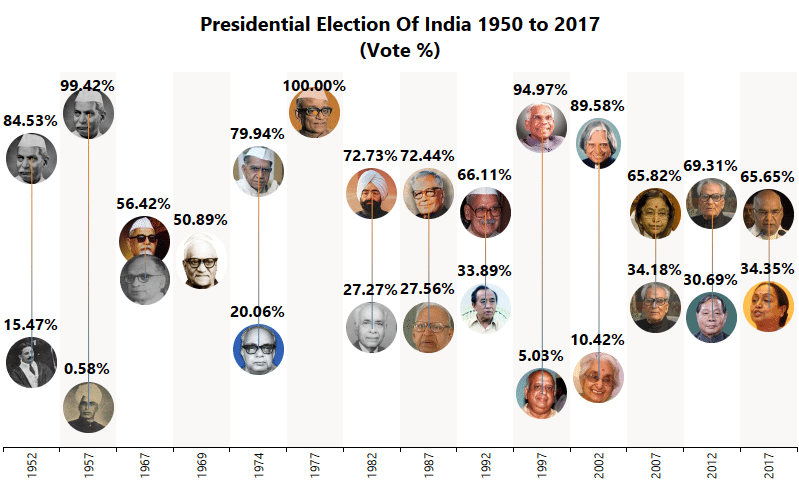
What is best way to represent Gap analysis using Visualizations? Area Chart, Line Chart or Dumbbell chart? I prefer dumbbell chart over area or line – it gives better idea over other two. Here is one simple example from the Indian Presidential Election.
From above chart –
1. Biggest Winning margin was in 1957
2. Lowest Winning margin was in 1969
3. In Recently concluded election – 31.3% was difference of votes between winning and losing candidate
Click here for interactive visualization.