Financial Data Analytics : How It Helps Businesspeople To Make Decisions

Relying on CA or Finance team to decipher your business financial data? Yes? Don’t worry, you’re not the only one.
Small or giant enterprises, finance function generates a large amount of data, which is a goldmine for conducting analyses, recognizing the trends, amplifying performance, creating better products and services, etc. But it is practically impossible for business owners to manage such data and derive actionable insights to make critical business decisions.
As per PwC stats, traditional financial reporting methods seem to consume a lot of time and effort. So, businesses need automated processes to analyze raw data sets rather than relying on CA or financial account managers to obtain meaningful information while providing appropriate data insights to make informed decisions. Financial Data Analytics is helpful in this regard, as it enables business owners and key stakeholders (non-finance background stakeholders) to uncover valuable insights, identify areas of improvements and manage financial risks in an effective way.
Static Financial Reporting:
When it comes to effective financial reporting, companies still rely on static financial reports and circulating static PDFs among their selected employee groups. Static reports might provide valuable information about a specified period, but it is practically impossible to investigate further the collected insights. In addition, these reports have short shelf-lives, thereby not giving enough opportunities to the stakeholders to retrieve more information.
Such reporting methods are beneficial for weekly or monthly financial reports. But they aren’t good enough for reviewing the business’s overall financial performance. The worst here is that it tends only to capture the financial status at that moment. So, ultimately, it cannot help decision makers to make appropriate business decisions.
Such hassles are the root cause of why professionals are transitioning to use dynamic or real-time reports to simplify this process. Such automated options will only help retrieve data insights that can help with practical and better business decisions. Dynamic reporting helps in conducting basic and advanced data analysis.
Storytelling in Finance and Accounting:
Is storytelling necessary while presenting your financial records? Yes, because it is the best way to present to and influence your stakeholders, as they might not always be in sync with the non-finance and finance business functions.
As per the 2018 survey conducted among more than 900 finance people, Accenture found that around 81 percent of the respondents identified data storytelling as one of the essential skills for these professionals.
So, storytelling is crucial as it helps businesspeople to bring data to life by transforming it into accessible and attractive visual formats. As a result, they can build narratives and influence decisions and actions while helping the experts develop better strategies.
These data stories are often memorable and help seamlessly explain numbers to stakeholders. Ultimately, it can motivate decision makers to make informed decisions while you deliver precise, clean, transparent finance messages by turning complicated financial statements into impactful insights.
Dynamic Financial Dashboards- A Better Approach Than Static Reporting
As already highlighted above, dynamic financial reporting is an excellent way to review business performance. Modern leaders are more concerned about depicting the constant financial changes in their business landscape while adopting the best technology to keep in sync with the same changes.
In the dynamic reporting system, the data is always interactive. That means you can investigate any figure and find relevant answers to make proactive decisions without any issues.
Furthermore, dynamic reporting enables you to access information rather than locking it away in spreadsheets within legacy systems. So, you can consider this the ultimate tech solution that is useful for automatically pulling all relevant data from ERP while presenting it in the universally accessible format for business reviews.
Customizable
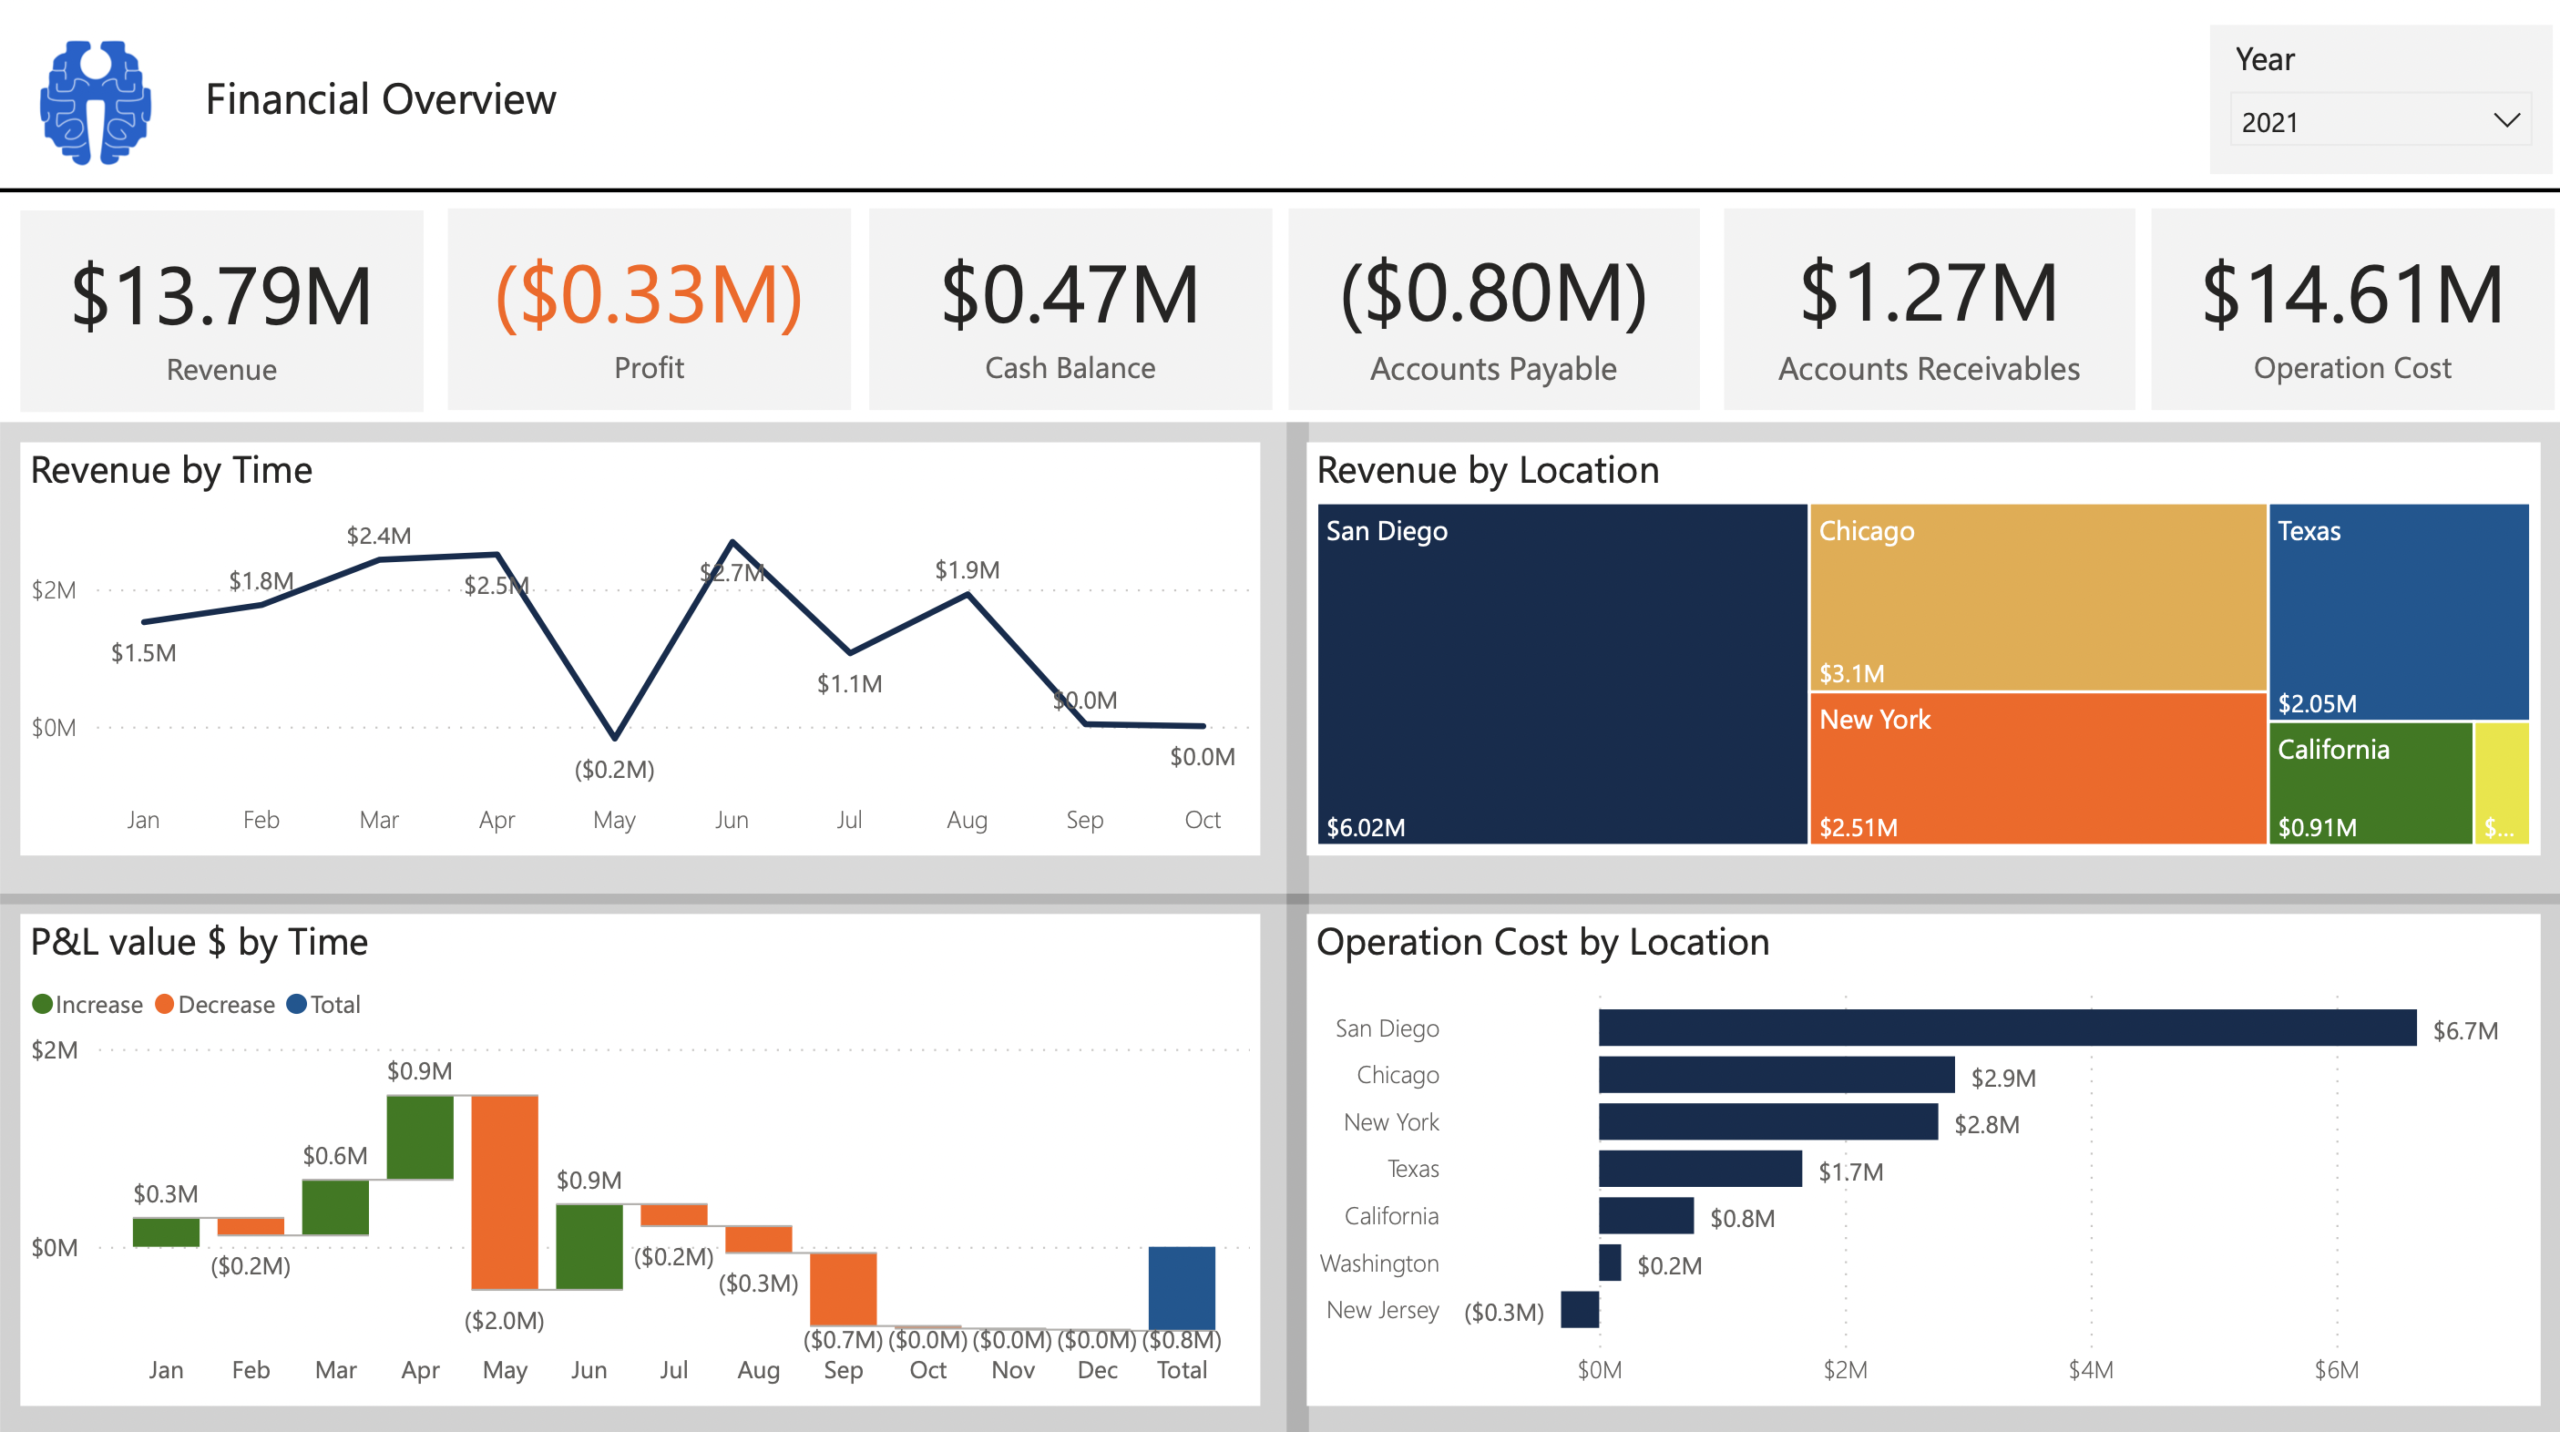
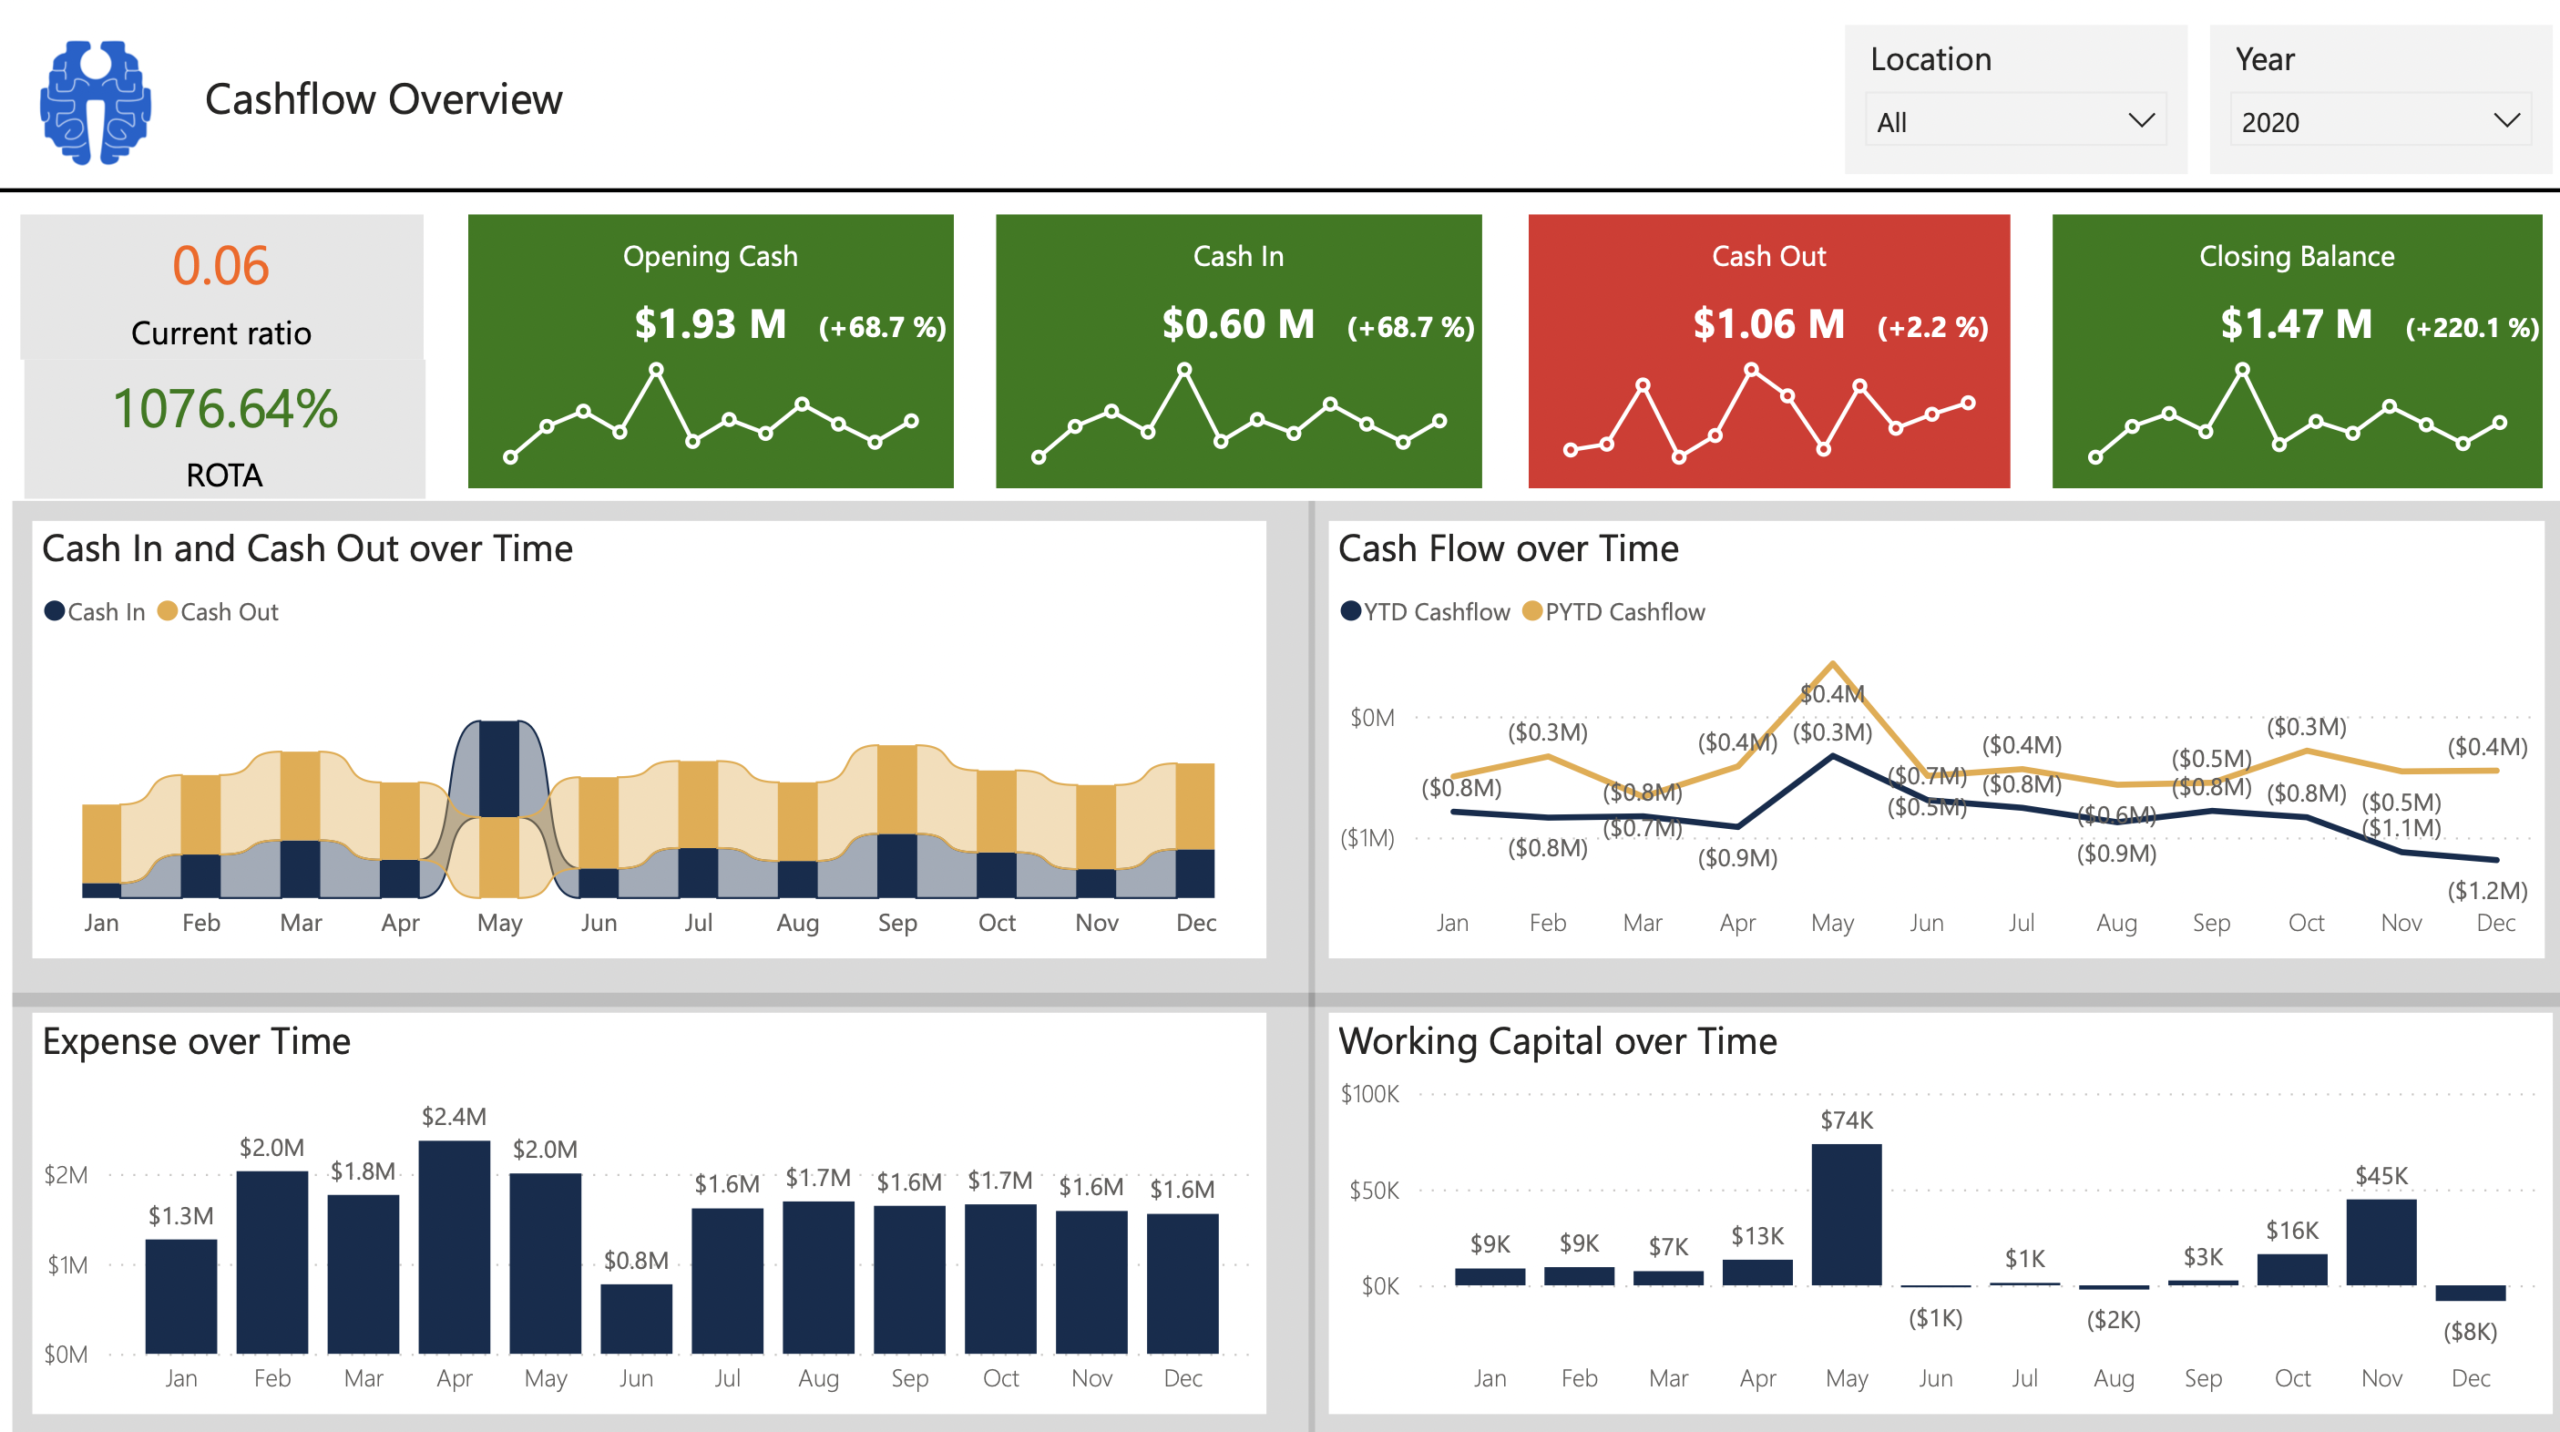
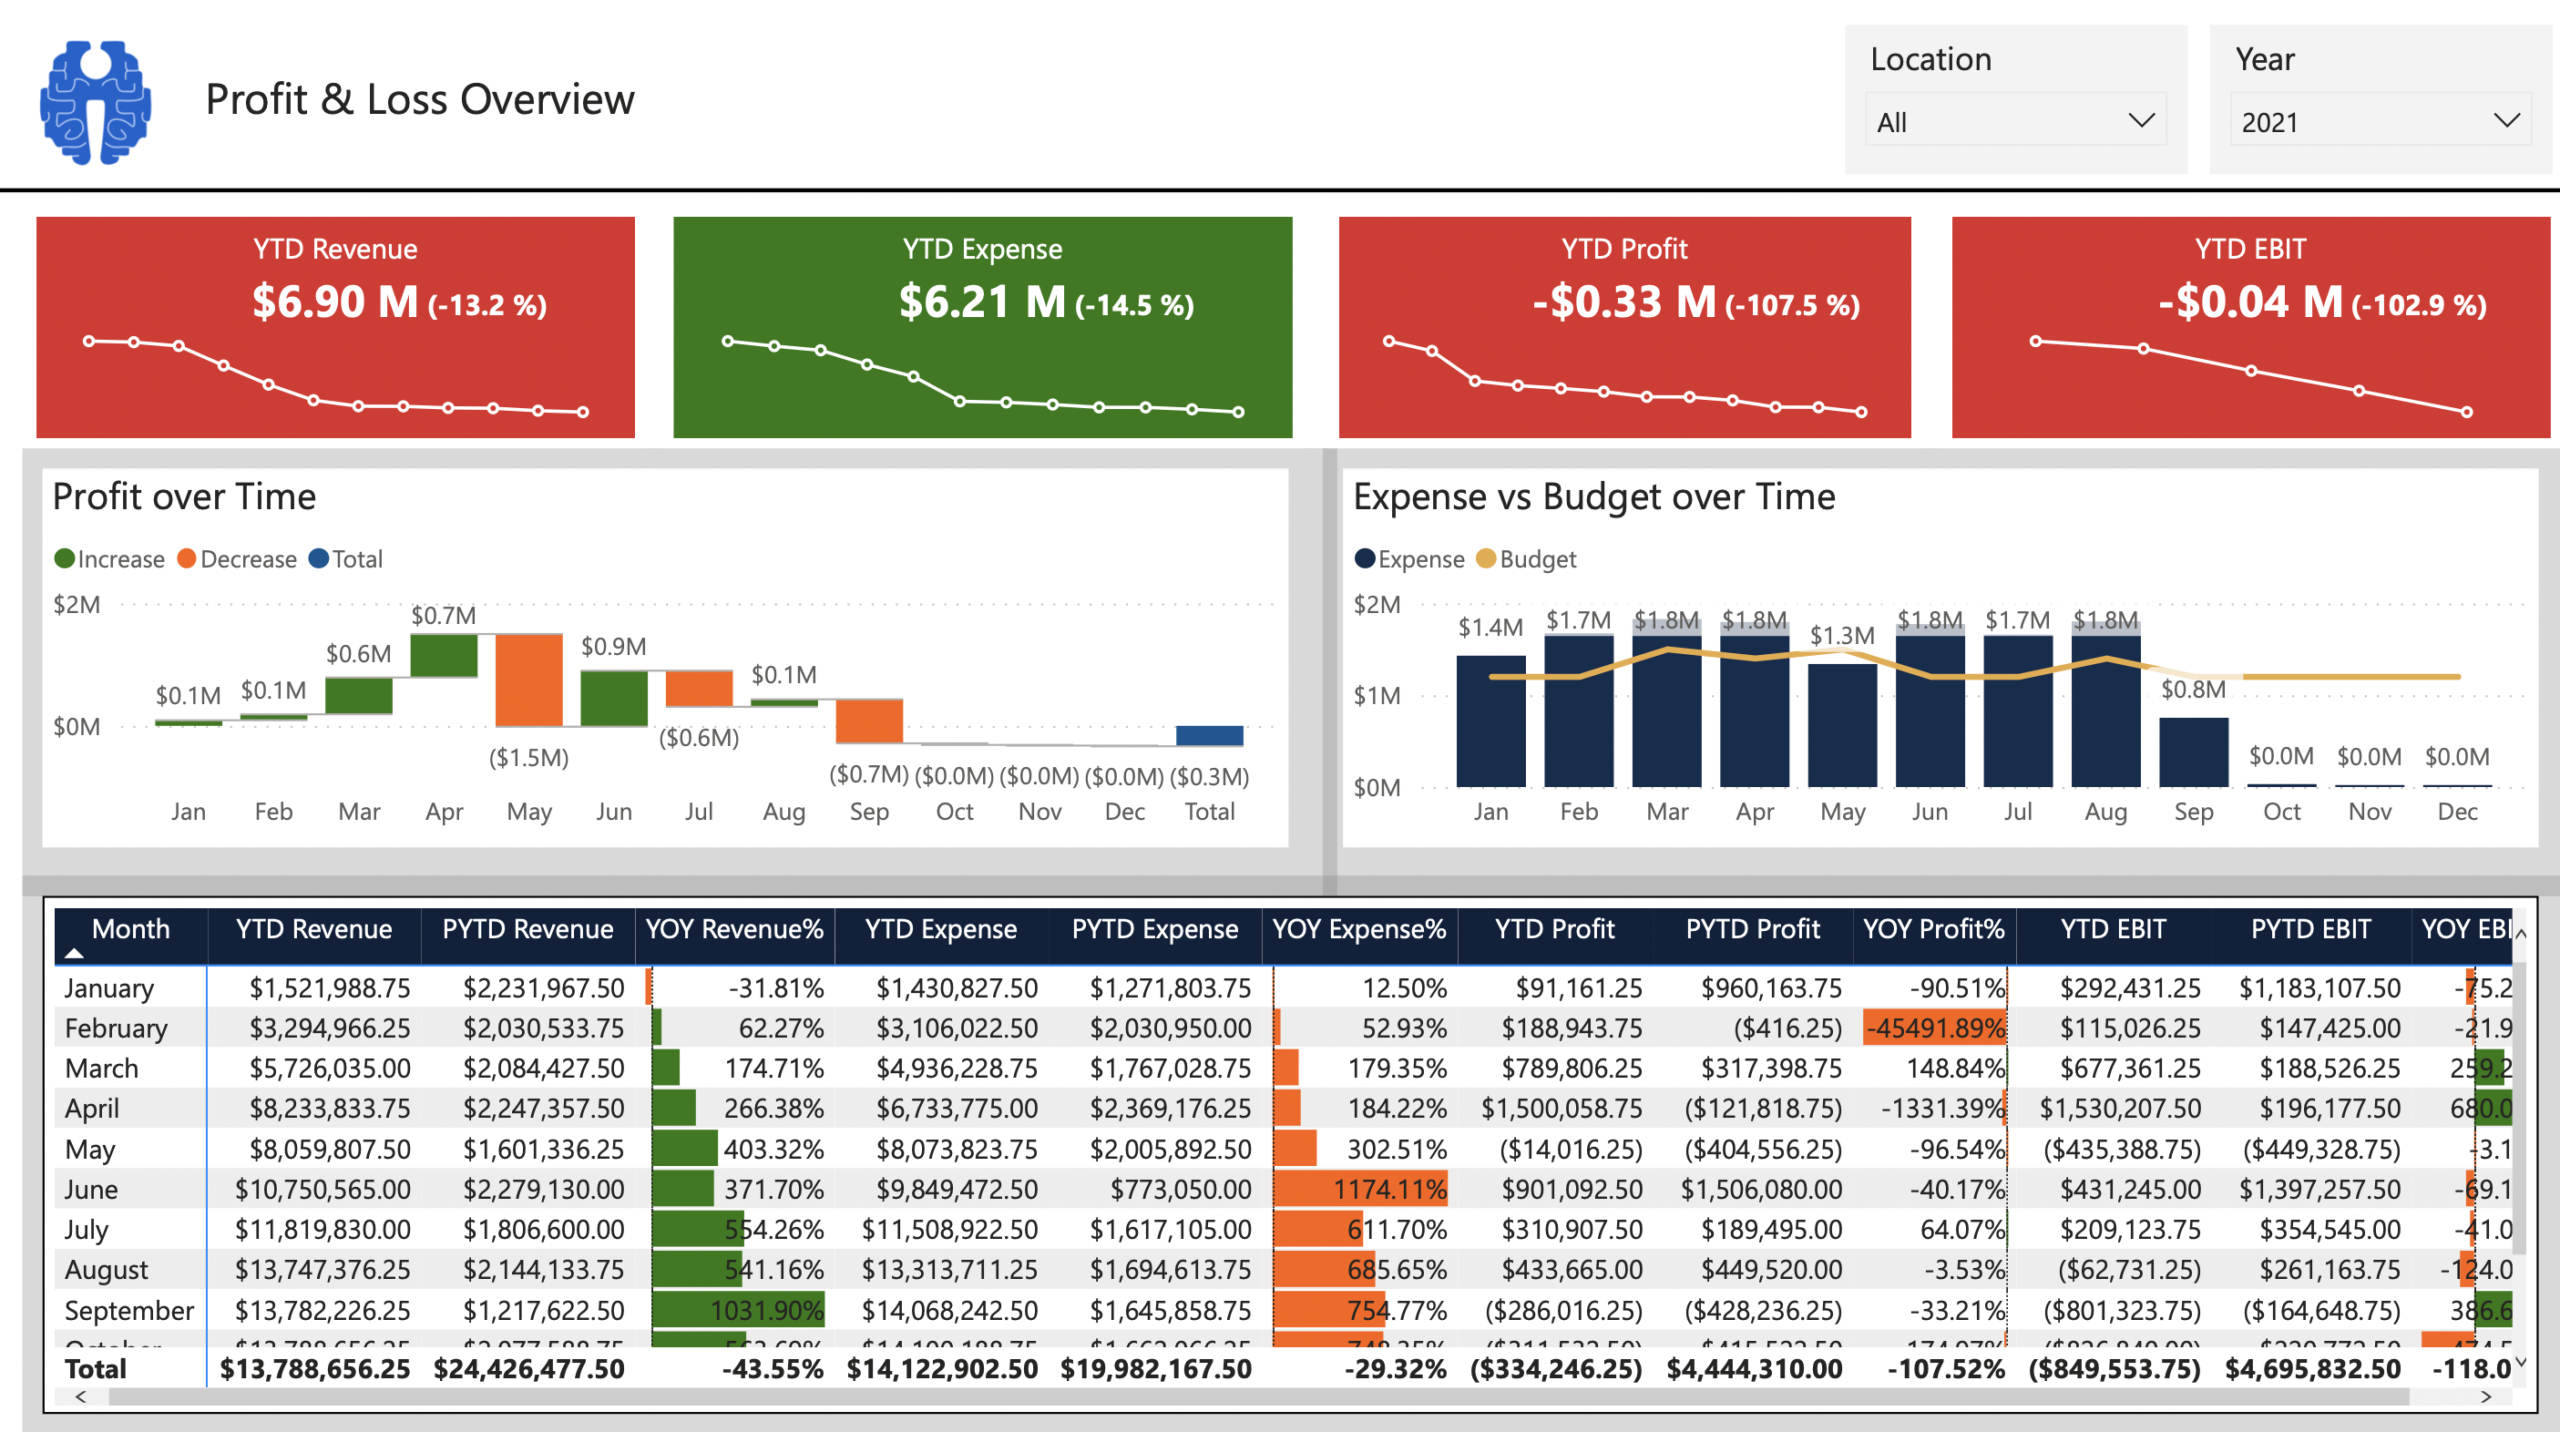
Dynamic reporting tools allows the users to create reports as specific as possible per the nuances of the business. Some unique dashboard features that simplify and help in customizing the financial statements are cash in, cash out, cash flow over time, expense over time, working capital over time, revenue by time, location, operation cost by location, etc. Here are a few screenshots of Intellify’s dashboards to give you a better understanding.

Intellify’s Financial Analytics Dashboard 1

Intellify’s Financial Analytics Dashboard 2

Intellify’s Financial Analytics Dashboard 3
Such reports are helpful for companies that need to manage their income statistics, financial KPIs, and balance sheets. Also, it can be automatically updated from the monthly ERP data, which makes the entire process pretty seamless and time-saving.
More Responsive
Reports being dynamic help your professionals to save time and other business resources. How? Well, the stakeholders no longer need the traditional month-end presentations from your CFO as they already have access to the information.
Rather than spending so much time and effort building custom graphical displays, one can now focus on incorporating responsive design elements to demonstrate the results adequately. Also, it helps offer a clear understanding of the reports and data insights collected, facilitating data driven business decisions.
More Strategic
Finance professionals are always tied up with massive transactional data. That is why they need data automation and immediate switch to dynamic reporting.
The more the transactional work gets automated, the better it gets for financial experts to focus on deriving the results from in-depth data analysis. Going beyond the data presented on a financial statement, connecting data from different business functions such as purchase, HR, Operations, Supply chain helps revealing the relationships between financial and non-financial data. Having cross functional dashboards at point of use creates strategic advantage while drafting business strategies.
Shifting Towards Interactive Dashboarding with Intellify’s Financial Analytics Solution
Interactive dashboarding might require a different mindset with great automation, accessibility, responsiveness, and more to empower your team to do their job efficiently while delivering the expected results.
So, who can be your ultimate partner in this regard? None other than Intellify’s Financial Analytics Solution! It will help you generate and automate the interactive reporting without hassles.
It is a highly powerful, decisive, scalable, and secure solution that enables users to easily interpret, analyze and share appropriate financial data insights with the stakeholders. And the best part of it is that it all happens within just a few clicks.
Some of the highlights of our solution are:
- Easy-to-understand financial insights
- End-user perspective dashboards
- 80+ Industry standard KPIs
- 13+ Interactive Financial dashboards
- Quick to implement
With this platform, you can use sophisticated algorithms and select patterns to predict the future. In short, Intellify brings you all the required tools and strategies to master comprehending data insights for better decisions. Multiply your ROI by dynamic reporting of your financial data with Intellify’s Financial Analytics Solution.
