
What is Linear Regression?
Machine Learning – Regression
Regression analysis is one of the predictive modelling technique used to identify the relationship between identified variables, typically referred as a Dependent Variables(s) (target) and Independent Variable.
Independent Variable is the one which is considered to be predicted. For e.g. Sales Forecast. In this case Sales Amount is the Independent Variable whereas Discount, Order Quantity or Rate are Dependent Variables.
There are several types of regression techniques available. Few of them are –
- Linear Regression
- Logistic Regression
- Lasso Regression
- Polynomial Regression
- Elastic Net
- Ridge Regression
Machine Learning algorithm works best under a given set of conditions so depending on what you need to predict, one needs to carefully choose the one best suitable algorithm. To ensure the best results / outcome, data scientist needs to make sure the algorithm fits the assumptions and requirements of predictions.
One cannot use any algorithm to predict anything. For e.g. Linear Regression cannot be used to predict whether a customer will buy a house or not. For this case, one should consider Logistic Regression, Support Vector Machine (SVM), Decision Trees, Random Forest, etc.
Basically there are different statistical algorithms that needs to be used for different use cases –Dependent Variables, Independent Variable and Problem statement decide which algorithm(s) needs to be used.
What is Linear Regression?
Linear Regression is used to forecast values based on currently available data. Predicting the sales forecast or Identifying the relation between earnings and spending are some of the examples. Sales Forecast can also be predicted based on time, but the forecasting which is done based on time is called Time Series Analysis (Please refer to upcoming blog on Time Series Analysis for more details) and is different from Linear Regression.
In Linear Regression, Dependent Factors other than time are considered. E.g. Sales Predications are better explained based on Total Quantity Purchased, Discounts Offered rather than the time of sale.
Linear Regression is a basic and most widely and commonly used type of predictive analysis technique. Linear Regression mostly works well on the Continuous Data and is based on study of existing data and patterns thus, it is a part a of Supervised Learning category.
Linear Regression is of two types –
- Linear Regression with one Independent Variable
- Linear Regression with multiple Independent Variables
In Linear regression, there are three major factors which needs to be considered –
- # of Independent Variables,
- Type of Dependent Variable
- Shape of the Regression Line
Regression Line is the best fit straight line depicting the relationship between Dependent Variable and Independent variables.
How do you test Model Accuracy?
Few of the techniques are –
- Loss Functions like –
- Mean Absolute Error (MAE) – Mean of Absolute value of the errors
- Mean Squared Error (MSE) – Mean of Squared Errors
- Root Mean Squared Error (RMSE) – Square Root of Mean of the Squared Errors. It is an absolute measure of fit.
- R Squared – Relative Measure of fit
- Adjusted R Squared
To optimize the accuracy of the model, there are various aspects to be considered. Some of the important aspects are –
- The data is modelled using a Straight Line
- This is best used with Continuous Variable e.g. Age, Temperature, etc.
- This is used to predict the Value of the Dependent variable
- Dependent and Independent variables should indicate a linear relationship
- Linear Regression is very sensitive to Outliers. One needs to take care of or avoid outliers to the extent possible. Depending on the data and model efficiency, one should consider how to treat outliers.
- Eliminate Missing or NULL Values – Check the values which are missing and fill those replacing with zero, mean, median, etc. Important factor in model accuracy.
- Ensure you have sufficient data – Try adding more data into your dataset to improve the accuracy.
- Feature Engineering and Selection– This technique will help you identify important Independent Features/Variables available in your data set. You should try with multiple features sets to check model accuracy. It is also effective and beneficial to try various features and test which features offers greater model accuracy. There are various methods for Feature Selection viz – Enter (Regression), Stepwise, Backward Elimination and Forward Selection. So with same set of variables – you can create multiple models and select the one with best accuracy.
- Develop Multiple Algorithms – Try to develop multiple Models and test them for better accuracy and choose the best fit for your data.
- Tune the Model – Tune the model to get more accuracy using various techniques from Feature Selection.
- Train and test the model accuracy – This is one of the proven method to test the model accuracy. Typically the existing data is divided in proportion of 80:20 – 80% of the data is used for training the model and 20% of the data for testing the model. Some may use 70:30 or 60:40 depending on the model accuracy, data availability and accuracy requirements.
Let’s see Simple examples –
Linear Regression with Single Independent Variable
HR wants to know, based on number of years of experience a candidate has, how much salary they should offer?
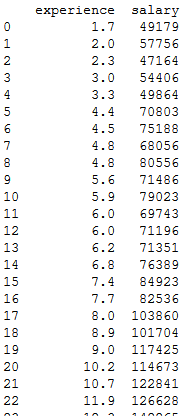
Let’s see a salary sample data available to build the model. The data contains Experience and corresponding Average Salary. The data is cleaned and all the missing values were updated with mean before feeding to model.
To train the model random 70% records were selected from the data set of 2000 records and 30% were kept for testing the model accuracy. As this is Simple Linear Regression example, only One Independent Variable/Feature column is considered in this example. The sample code is written in python which uses various build in libraries like numpy, pandas and matplotlib to load and conduct arithmetic operations.
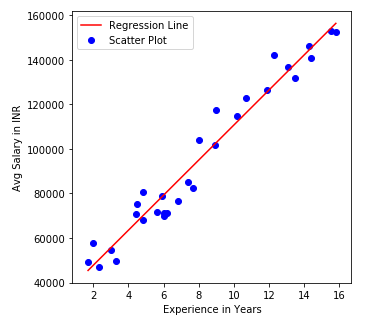
From above graph, we can see a clear Regression Line depicting a relation of Experience and Salary. The blue dots represents the actual salary based on the experience drawn on X-axis. Typically, you get two types of slopes, Positive Slope and Negative Slope. The below graph indicates a positive slope that means, there is a positive relation between Experience and Salary. In simple terms, Experience is directly proportional to Salary. In negative slopes, it’s Inversely Proportional.
The regression line in simple linear regression is a straight line which is mathematically represented as y = mx +c, where y is the value to be predicted, m is the Gradient of the Line and c is where it intercepts with y.
In simple words
y = how far up
x = how far along
m = Slope or Gradient (how steep the line is)
c = value of y when x=0
The m is calculated as
m = Change in Y / Change in X
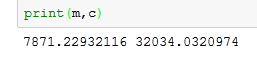
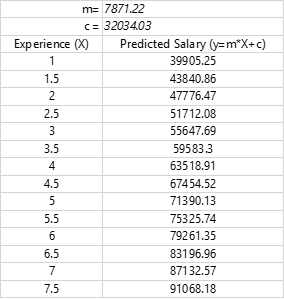
The model has identified the values of m and c as 7871.22 and 32034.03 respectively
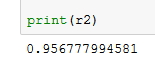
The accuracy is calculated using the R squared method, and this model has returned an accuracy of 0.95 which is decent enough to adopt this model. So as a reference for salary to be offered, one can use below table as a reference. If you look at the original data provided, the predicted values are pretty close.
Linear Regression with Multiple Independent Variables
In the given dataset, let’s assume the Salary component is not only dependent on Experience in Years but also on Employee Age, No of Years Employee is Associated with a company and Current Skills Level. As the salary component is dependent on multiple variables, this will a Multi-Linear regression Problem.
Let’s look at the dataset–
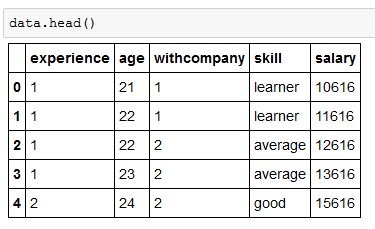
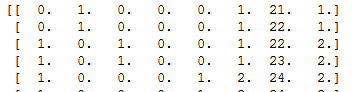
In the dataset, the skill levels are defined as Learner, average, good and expert. So, we need to encode this data into columns like pivoting, making it a flat structure.
After encoding, the data look like this –
The dataset is divided into 80:20 for training and testing.
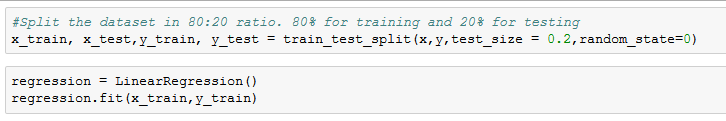
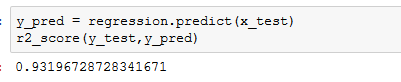
Looking at mode accuracy using R Squared score which is approximately 93% is quite a decent score.
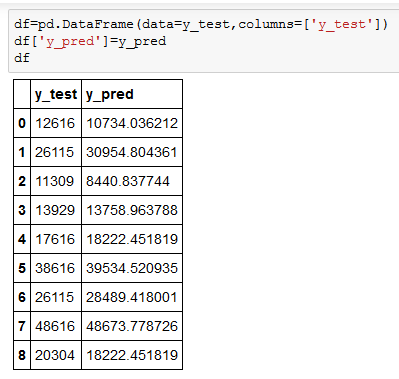
These are the actual and predicated values for your reference –
For more information about Jupitor Notebook and Sample data considered here – we can be reached at contact@intellifysolutions.com