
Real-Time Operational Dashboards:
Design Patterns & Best Practices
1. Choosing the Right Dashboard Architecture
Not all real-time operational dashboards should be built the same way. The right architecture depends on the operational latency requirement, the volume of historical context needed, whether automated action is required, and whether the dashboard must serve both operational and analytical users.
Four proven patterns address these distinct requirements. None of them is universally “best” each is a deliberate trade-off between speed, complexity, historical depth, and automation. The sections below walk through each pattern, when to reach for it, and where it breaks down.
2. Pattern 1 – Lambda (Speed + Batch Layer)
The Lambda pattern maintains two parallel data paths: a speed layer that processes streaming events through Eventstream into Eventhouse for real-time dashboard queries, and a batch layer that processes the same events through Lakehouse pipelines for historical accuracy and reconciliation. A serving layer merges the outputs for unified Power BI consumption.
When to use: Financial transaction monitoring or logistics tracking where real-time speed is operationally critical but historical data must be reconcilable against authoritative source-of-record systems. The Lambda pattern accepts architectural complexity in exchange for both speed and correctness.
3. Pattern 2 – Kappa (Unified Streaming)
The Kappa pattern eliminates the separate batch layer by processing all data historical backfill and real-time events through the same Eventstream pipeline into Eventhouse. When corrections or historical reprocessing are needed, the same streaming pipeline is replayed from source.
When to use: IoT equipment monitoring, logistics fleet tracking, or any high-frequency operational monitoring scenario where a single streaming truth is more valuable than the complexity of maintaining two parallel data paths. This is the simpler and more maintainable pattern for most RTI use cases.
4. Pattern 3 – Activator (Event-Driven Intelligence)
The Activator pattern positions the dashboard as a secondary interface the primary value delivery is through automated Activator reflexes that detect and respond to operational conditions without requiring human monitoring. The dashboard provides the investigation and context layer for events that Activator has already surfaced.
When to use: Mission-critical monitoring where the cost of delayed detection is high equipment failure prevention in manufacturing, SLA breach detection in logistics, anomaly detection in financial systems. The Activator pattern is applicable in combination with Pattern 1 or Pattern 2, not as a replacement for either.
5. Pattern 4 – Hybrid Composite Model
The Hybrid pattern uses a Power BI Composite Model to combine two distinct data connections in a single report: a DirectQuery connection to Eventhouse for live operational KPIs, and an Import-mode connection to the Lakehouse semantic model for historical trend analysis, calculated business metrics, and dimensional context.
When to use: Dashboards that must serve both operational frontline users (who need live data with sub-10-second freshness) and management or analytical users (who need 12-month trend context and complex DAX business metrics). This is the most common pattern for executive operational dashboards that require both dimensions.
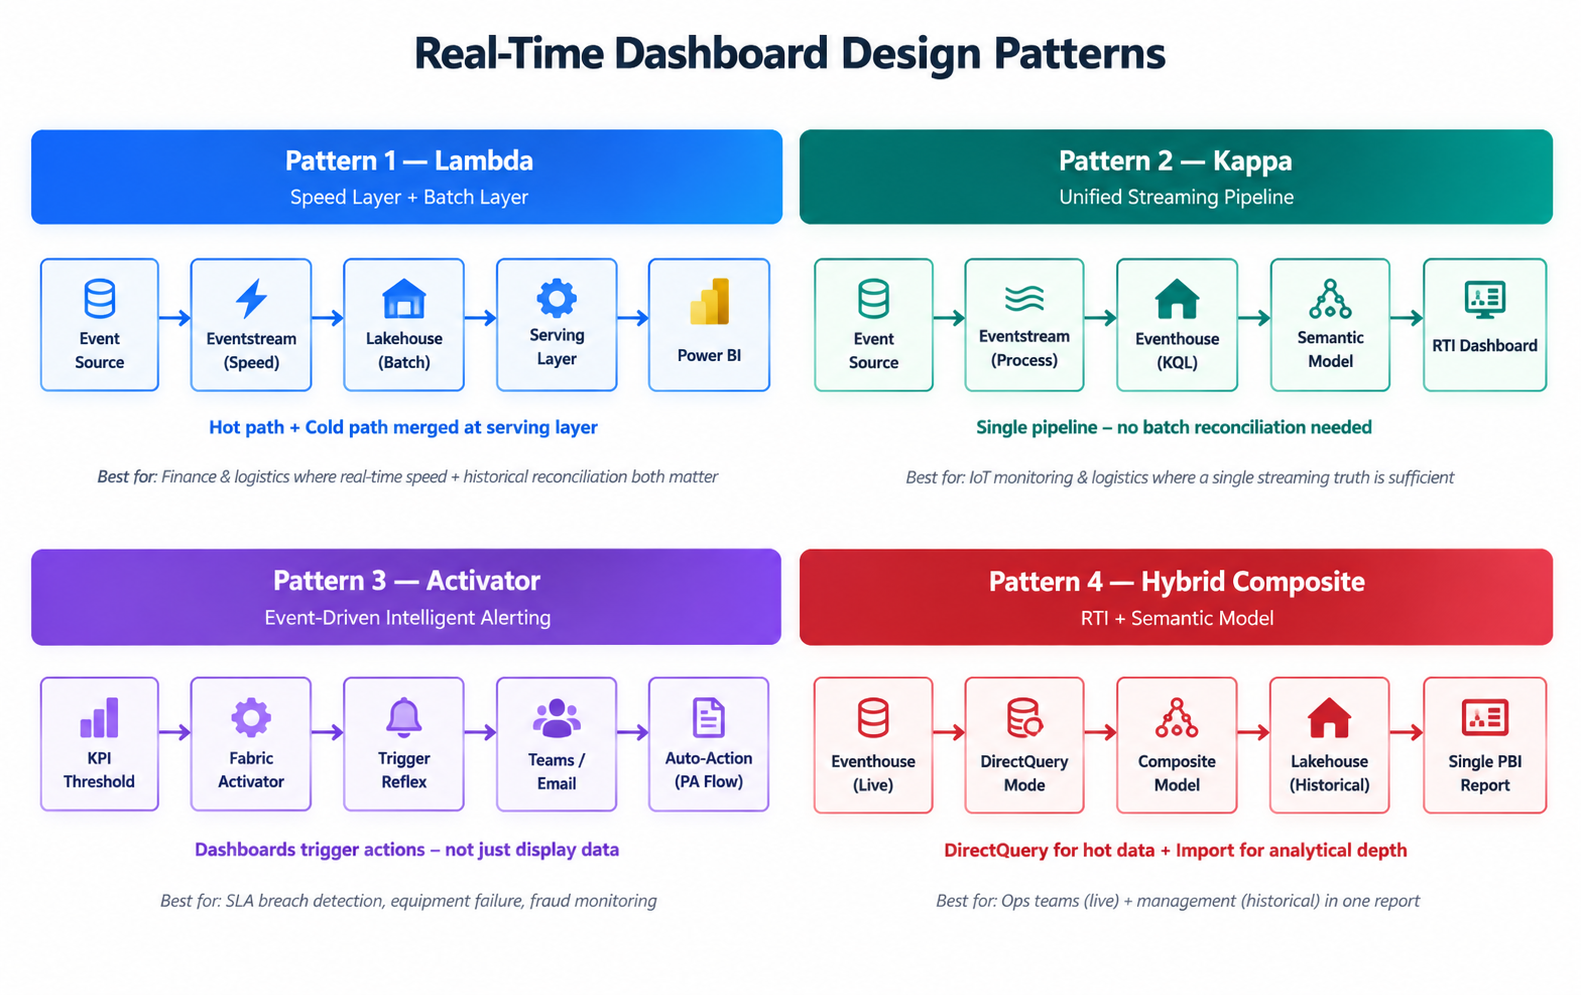
Figure 1: Four Real-Time Dashboard Design Patterns – Lambda, Kappa, Activator, Hybrid Composite
6. Enterprise Best Practices
The following practices are distilled from enterprise RTI implementations. They address the failure modes and architectural shortcuts that create technical debt in real-time pipelines and prevent dashboards from delivering sustained operational value at scale.
1. Define Latency Budgets Before Choosing Architecture
The single most common mistake in RTI projects is building a sub-second streaming pipeline for a use case that can tolerate 30-second data freshness. Define explicit latency budgets per dashboard use case before selecting architecture components. Sub-second requires streaming datasets. 5 to 10 seconds can use DirectQuery with APR. 30+ seconds can use import with frequent scheduled refresh. Right-sizing prevents over-engineering.
2. Always Abstract KQL Tables Behind Views or Functions
Never connect Power BI DirectQuery directly to raw event tables in Eventhouse. Always create KQL functions or materialized views as the abstraction layer. This decouples dashboard development from schema evolution, enables consistent KPI definitions across multiple dashboard consumers, and allows query optimization without breaking existing report connections.
3. Design Activator Reflexes Before Dashboard Visuals
Define operational thresholds, escalation paths, and Activator action targets as the first step in every RTI implementation before a single Power BI visual is created. Automated alerting is the primary value delivery mechanism. The dashboard is the secondary investigation interface. Building in this order prevents dashboards from becoming the primary (and fragile) monitoring mechanism.
4. Implement Two-Tier KQL Table Design (Hot + Warm)
Design Eventhouse KQL databases with separate table tiers: a hot table for recent events (last 24 to 72 hours, optimized for sub-second dashboard queries) and a warm table or materialized view for aggregated historical data (7 to 30 days, for trend analysis). Use KQL update policies to automate data movement between tiers. This pattern reduces dashboard query costs and improves performance without manual DBA intervention.
5. Apply Row-Level Security at Both Eventhouse and Semantic Model Layers
When operational dashboards expose sensitive data patient records, financial transactions, equipment performance data by production line apply RLS at both the Eventhouse level (using KQL restrict statements in query functions) and the Power BI semantic model level. Never rely on a single RLS layer. A user with direct KQL access could bypass Power BI-level RLS if Eventhouse restrictions are not also in place.
6. Use Materialized Views for All Dashboard KPI Aggregations
Dashboard queries with Auto Page Refresh enabled at 1 to 5 second intervals can generate significant query load on Eventhouse. Pre-compute all KPI aggregations required by dashboard tiles as Eventhouse materialized views. Materialized views are updated incrementally as new events arrive they do not require full table recomputation. This reduces dashboard query execution time from seconds to milliseconds for common operational metrics.
7. Validate Stream Data Quality Within Eventstream
Implement data quality validation at the Eventstream transformation layer before events reach Eventhouse. Use conditional routing to filter null device IDs, validate temperature readings against physically plausible ranges, deduplicate events using unique event ID fields, and route malformed records to a dead-letter table for investigation. Data quality issues caught at ingestion prevent cascading errors in KQL queries and dashboard KPIs.
8. Track End-to-End Lineage with Microsoft Purview
Connect Microsoft Purview data catalog to the Fabric workspace to capture end-to-end lineage from streaming event source through Eventstream transformations, Eventhouse tables, KQL functions, and Power BI datasets. This lineage is essential for impact analysis when source schemas change, for compliance audit trails in regulated industries, and for onboarding new team members to the RTI pipeline without weeks of documentation review.
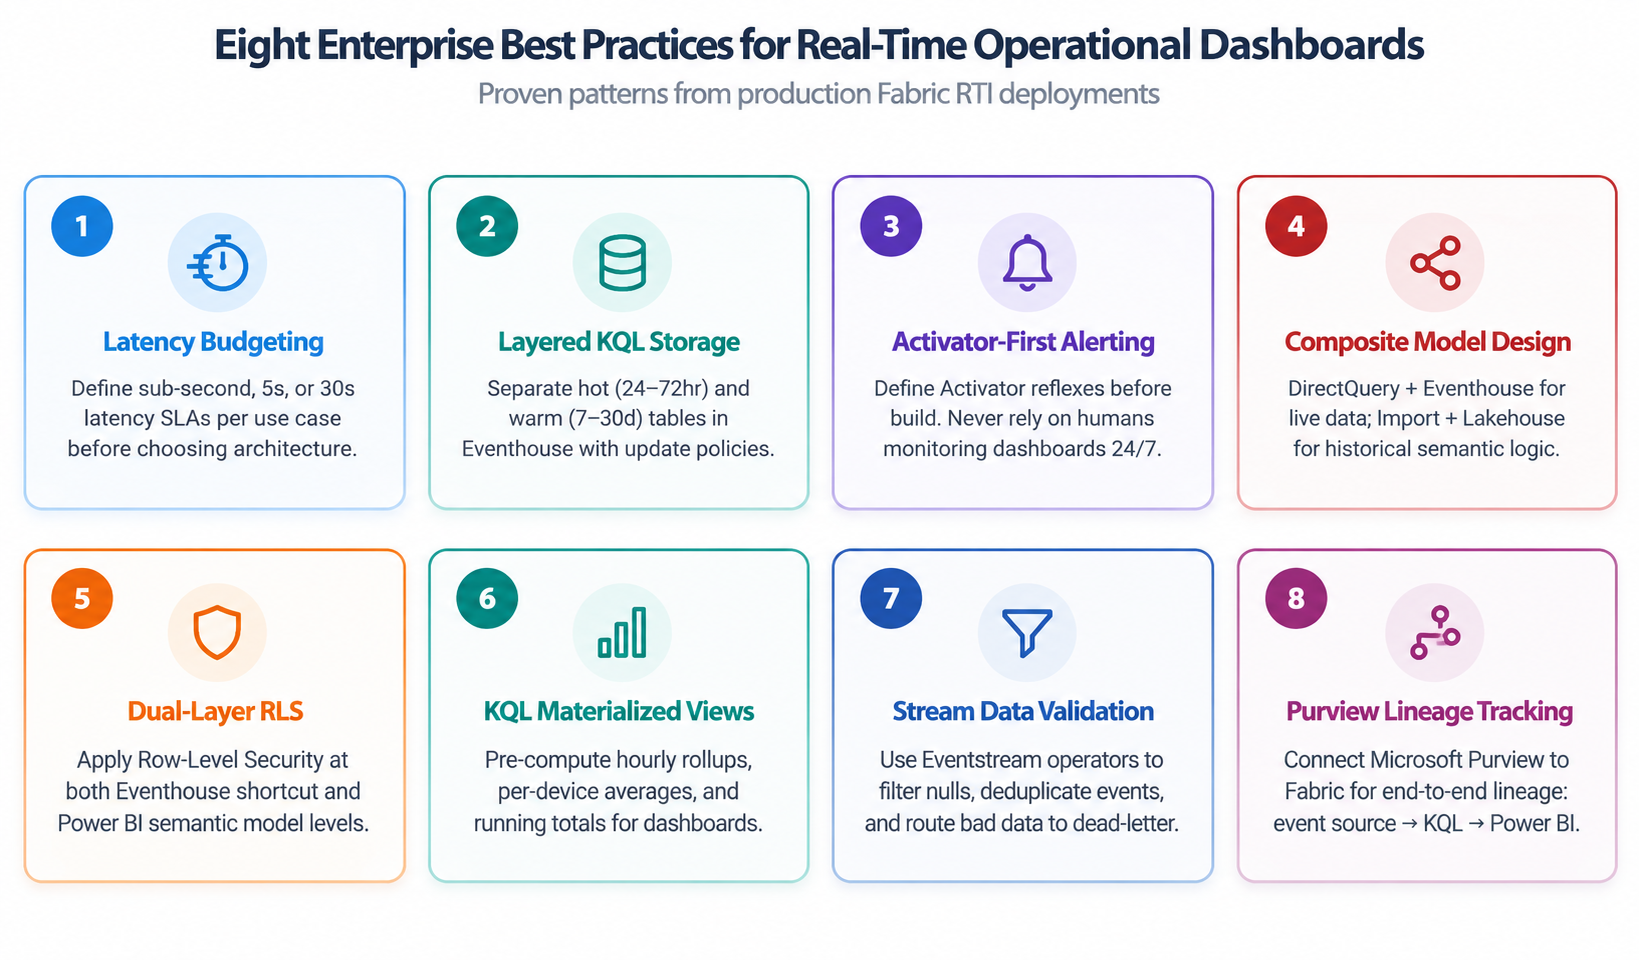
Figure 2: Eight Enterprise Best Practices for Real-Time Operational Dashboard Implementations
7. Conclusion
Real-time operational dashboards represent a fundamental shift in how enterprises use data. The transition from batch-refresh BI to streaming intelligence is not incremental it requires rethinking the data pipeline from ingestion through to the action layer, with architecture decisions made against explicit operational latency budgets and defined MTTD targets.
Microsoft Fabric RTI provides the infrastructure for this shift. Eventstream handles universal streaming ingestion without the operational overhead of managing separate Kafka clusters or Stream Analytics jobs. Eventhouse delivers the time-series analytical performance that operational dashboards require, at a scale that traditional relational databases cannot match. Activator closes the loop from observation to action transforming dashboards from passive displays into active operational intelligence systems.
But technology is the easier half of the problem. The architectural and design decisions choosing the right pattern for each use case, designing hot and warm data tiers in Eventhouse, building Activator reflexes before dashboard visuals, applying RLS consistently across the full stack are what determine whether an RTI implementation delivers sustained operational value or becomes another underutilized monitoring tool.
The organizations that extract the most value from real-time operational dashboards are not those with the fastest streaming pipelines. They are the organizations that have clearly defined the operational decisions their dashboards need to support, designed the alerting layer to close the loop on those decisions automatically, and built the governance foundation to scale the RTI platform across multiple operational domains without architectural fragmentation.
Blog Author