What Are Paginated Reports in Power BI Premium?

Paginated Reports are nothing but the SQL Server Reporting Services which is also now Part of Power BI Premium service. Reports are called ‘Paginated’ because reports are well formatted and can be printed or shared.
Paginated Reports for Power BI is one such reporting service that helps in creating visually appealing reports and allow users to insert all the relevant and crucial information into it using Power BI report builder.
Paginated Reports for Power BI allow complete control of all the elements in a report. It allows users to customize the field of each report. Fields like text size, colours, spacing, the print layout, can be all adjusted as per the users’ requirements. The Paginated Reports are also called pixel-perfect due to their ability to customize all the elements in the report.
Features of Paginated Reports
I. Data Sources
A single page Paginated Report can be linked with multiple data sources. Users can create embedded data sources in the report itself. However, shared data sources cannot be used for Paginated Reports. Various data sources can be connected in Paginated Reports such as:
- Oracle
- Power BI Premium Datasets
- Azure SQL Database
- Azure Analysis Services
- SQL Server via a gateway
II. Sensitivity Labels
Sensitivity labels in Paginated Reports for Power BI allow users to classify the level of confidentiality through the labels. On basis of the department, organization hierarchy and many such factors, access to reports can be shared with limited people in an organization. Not all reports are meant for all the employees or managers and therefore, sensitivity label plays an important role in terms of providing access to users. Depending on the level of confidentiality, users can assign reports as non-business, public, general, confidential, and highly confidential.
III. Charts & Free-Form Layouts
In Paginated Reports, users can create various types of layouts. Be it a table, charts or a layout that has no fixed template such as invoices & receipts, all such graphical presentation is made possible in Paginated Reports. Matrix reports are useful to provide information in summarized form.
With the help of Report Builder wizards – tables, charts and matrix can be built and embedded with a data source connection. As mentioned above, multiple data sources can be connected in a Paginated Report and therefore, each graphical representation can be connected to a different dataset altogether.
IV. Report Definition
Paginated Report is not pre-defined. It helps you to define the report and help you to gather data, present it the way you want and so on. The report processor generates a report from the data you have inserted and combines it with a related layout. Users can upload the report definition to Power BI Services’s workspace with the employees of your organisation.
V. Exporting
Paginated Reports can be easily exported in MS Excel, MS Word, MS PowerPoint as well as PDF, CSV and XML formats. This way, files can be saved in any of the preferred formats and shared with respective people, in and outside the organisation.
VI. Email Subscription
Email subscriptions can be set up for Paginated Reports. The email can be sent to the report owner, team members or even people working outside of the organisation. The subscription attaches the report as a PDF in the email. Depending on how frequently you want to receive, the emails can be scheduled for daily, weekly or monthly recurrence.
When to Use Paginated Reports?
We now know the various features of Paginated Reports in Power BI Premium. Let us look at the applications of the reports.
You may require using Paginated Reports in the following scenarios:
- Page formatting requirements are strictly for professional reasons.
- Redesigning the current PDFs that have different visual elements like images, graphs, tables, etc.
- When you need to export a large amount of data from a table and create a visualization of the data in the table.
- Simple the page layout and make it easily readable and ensure that all the elements appear on a single page.
- When you require reports to be directly emailed to you and others once it is ready.
Examples of Paginated Reports
A. Sales Performance Report:
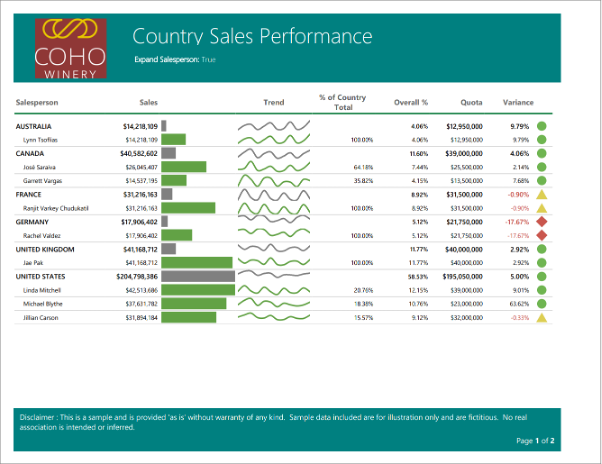
Below paginated sample report shows the pixel perfect printable report for countrywide sales. Report highlights paginated features like:
- Well formatted Headers and Footers
- Parameters to explain details in the table
- Data Bars
- Trend lines
- Expression Placeholders such as Up arrow, Down Arrows etc.

Source : microsoft.com
B. Invoice:
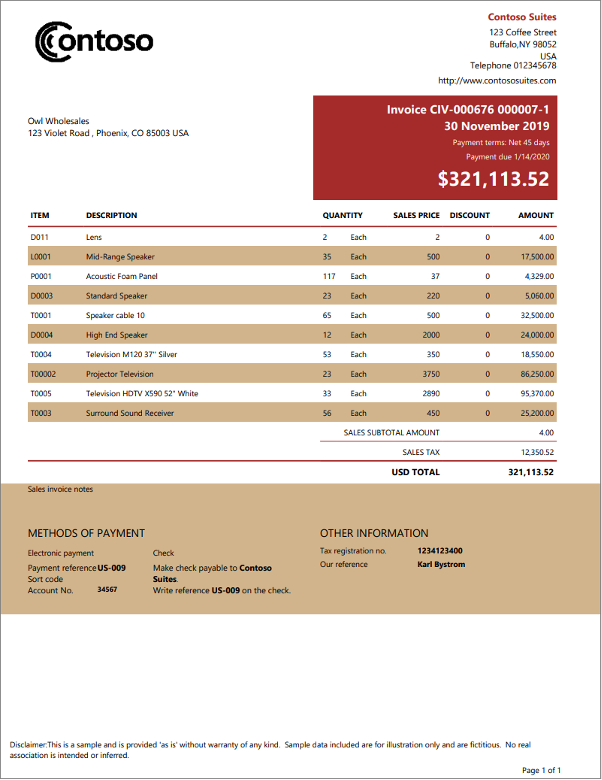
Here is another example of paginated report- Self-contained Invoice. It is a pixel perfect printable invoice showing total Invoice amount, with itemised costing of the purchased products, quantity, and discounts.

Source : microsoft.com
The Intellify Edge
Having decades of experience in the field of data visualization and business intelligence, there are various advantages of associating with us to enhance and grow your business.
Dedicated Assistance:
We provide dedicated account managers who can ensure you get the experts whenever you require it. Our account managers will be able to solve any and all types of problems you are facing while using our solutions.
Expert Consultancy:
Our professionals recommend you the services that will be best suited for your business. They have years of expertise in the field and truly understand the power of visualization. They understand the nuances of each solution being offered and therefore provide you with valuable advice.
Customized Solutions:
We at Intellify always believe in delivering tailor-made solutions to our partners. We understand the problem being faced by your organization and provide services according to your business needs. We design our solutions in such a way that they exactly match the requirements you are looking for.
Data Security:
We are the licensed partners of Microsoft and therefore, we can guarantee the highest level of data safety and security to your organisation. We ensure that firewalls are in place and data is encrypted in order to prevent it from any type of hack.
We at Intellify are bringing the revolution in the way reports, dashboards and KPIs are created, tracked and monitored. If you would like to be part of our journey and join hands with us or are interested to know more about how we are bringing this revolution, click here.
