How to Identify Influencer Data Points that Can Solve Business Pain Points?

Having large data and struggling to get the exact actionable insights to solve business pain point? This can also be termed as Analysis Paralysis.
Analysis paralysis (or paralysis by analysis) describes an individual or group process where over analysing or overthinking a situation can cause forward motion or decision-making to become “paralyzed”, meaning that no solution or course of action is decided upon within a natural time frame.
In this blog we will see how the business pain points are identified and data points related to those pain points? Different AI-ML techniques to identify Encouragers and Discouragers of the business pain point are also discussed.
Assumptions for this blog
Organization has defined processes and right Key Performance Indicators (KPIs) are being tracked regularly. But business decision makers find it difficult to nail the issue as they don’t know what set of data points causing the issue.
There are 4 stages of Analytics stages, and each has its own significance and needs. Read our latest blog on The Analytics Maturity Model which will help you understand at what stage of analytics you are at.
Identifying Business Pain Points
In order to identify business pain points, it is crucial to engage with stakeholders across each business processes, listen to their concerns and issues, and align them with the overall business goals. Typically, business pain points fall into three categories: low/unmanageable growth, people-related issues such as a lack of suitable talent, and low/high market share.
However, business pain points can be complex and intertwined making them difficult to address and resolve. To effectively tackle these pain points, it is important to first identify them and then involve the relevant departments and business process owners to gather additional data points and performance indicators. This collaborative approach can help businesses gain a deeper understanding of their pain points and identify potential solutions.
When dealing with large data sets across multiple business processes that have interdependent relationships, it becomes even more critical to gather the right information to gain insights and make informed decisions. By leveraging data-driven approaches, businesses can effectively identify and address their pain points, driving growth and success.
Do I know the data points that are part of my business pain point, and do I track performance Indicators?
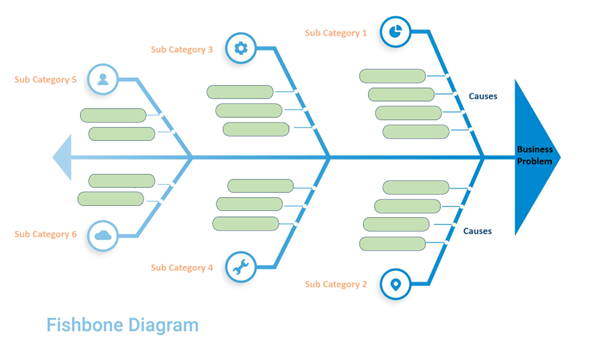
There are several structured methods available for identifying the root cause of a business pain point, such as Fish-Bone analysis, Fault Tree Analysis, Pareto Chart, Scatterplot Diagram, and 5 Whys Analysis. One effective method is the Fish-Bone diagram, also known as the Ishikawa analysis.
In a Fish-Bone diagram, the problem is defined at the head of the fishbone shape, with its causes and effects branching out behind it. Possible causes are grouped into categories that connect to the spine, providing an overall view of the factors contributing to the problem. This helps businesses gain a deeper understanding of the underlying causes of their pain points and identify potential solutions. See the sample diagram below for a visual representation of the Fish-Bone analysis.

For example, let’s consider the issue of low conversion rates in the Lending Business. In this case, the bones connecting to the spine of the Fish-Bone diagram are nothing but various data points that we need to gather from our source systems, data warehouse, or even procure from outside organizations for further analysis. By analyzing these data points, we can gain insights into the underlying causes of the low conversion rates and develop effective strategies to improve them.
How AI-ML can help in finding encouragers/ discouragers of my Pain Point?
There are multiple AI-ML techniques to find encouragers/ discouragers data points such as co-relation analysis and Clustering to get the solution. Co-relation techniques like
- Pearson correlation coefficient – This technique is used for measuring linear relationship between two variables and its values are calculated between 1 and -1. 1 – stands for positive correlation and -1 stands for negative correlation and 0 stands for not having any correlation at all.
- Spearman correlation coefficient – This measures the strength between two variables, regardless of whether the relationship is linear or not. This is often used when data is not normally distributed.
- Point-Biserial Correlation coefficient – This measures the strength between one continuous variable and one binary variable.
- Phi Correlation coefficient – This measures the strength between two binary variables
Correlation will help in finding the data point influencers to the decision variables – those data points might be influencing positively or negatively but they are influencing.
Once, influencers data points are found out – we need to cluster them so that we can understand which of the segments are positively influencing and negatively influencing.
Here are some of the clustering algorithms that can be used for clustering the influencers –
- K means – this uses centroid based approach to minimize the sum of squared distance between data points and their assigned centroid.
- Hierarchical Clustering – This algorithm creates a hierarchy of clusters by recursively merging or splitting clusters based on their similarity.
- Density-based clustering: This algorithm identifies clusters based on areas of high density in the data space. It requires the user to specify a density threshold and can be used to identify arbitrary-shaped clusters.
How Intellify can help you get those actionable insights to address your pain point with AI-ML solution?
As a solution partner, Intellify works closely with stakeholders from all involved business processes to ensure that all relevant data points are captured and analyzed.
By applying clustering techniques, the data can be grouped into “encouragers” and “discouragers” to help decision-makers focus on the factors that are positively impacting their goals while ignoring or excluding those that hinder progress. Over time, the percentage of discouragers will gradually decrease, resulting in better outcomes. However, it is important to note that new discouragers may emerge, so continuous evaluation and analysis is necessary for sustained success.
***
Intellify believes in creating single source of truth from multi data sources and provide state-of-the-art data infrastructure to improve, enhance and grow their business sustainably.
If you are looking to adopt a data driven decision making for your business, feel free to get in touch with our experts by clicking here.
