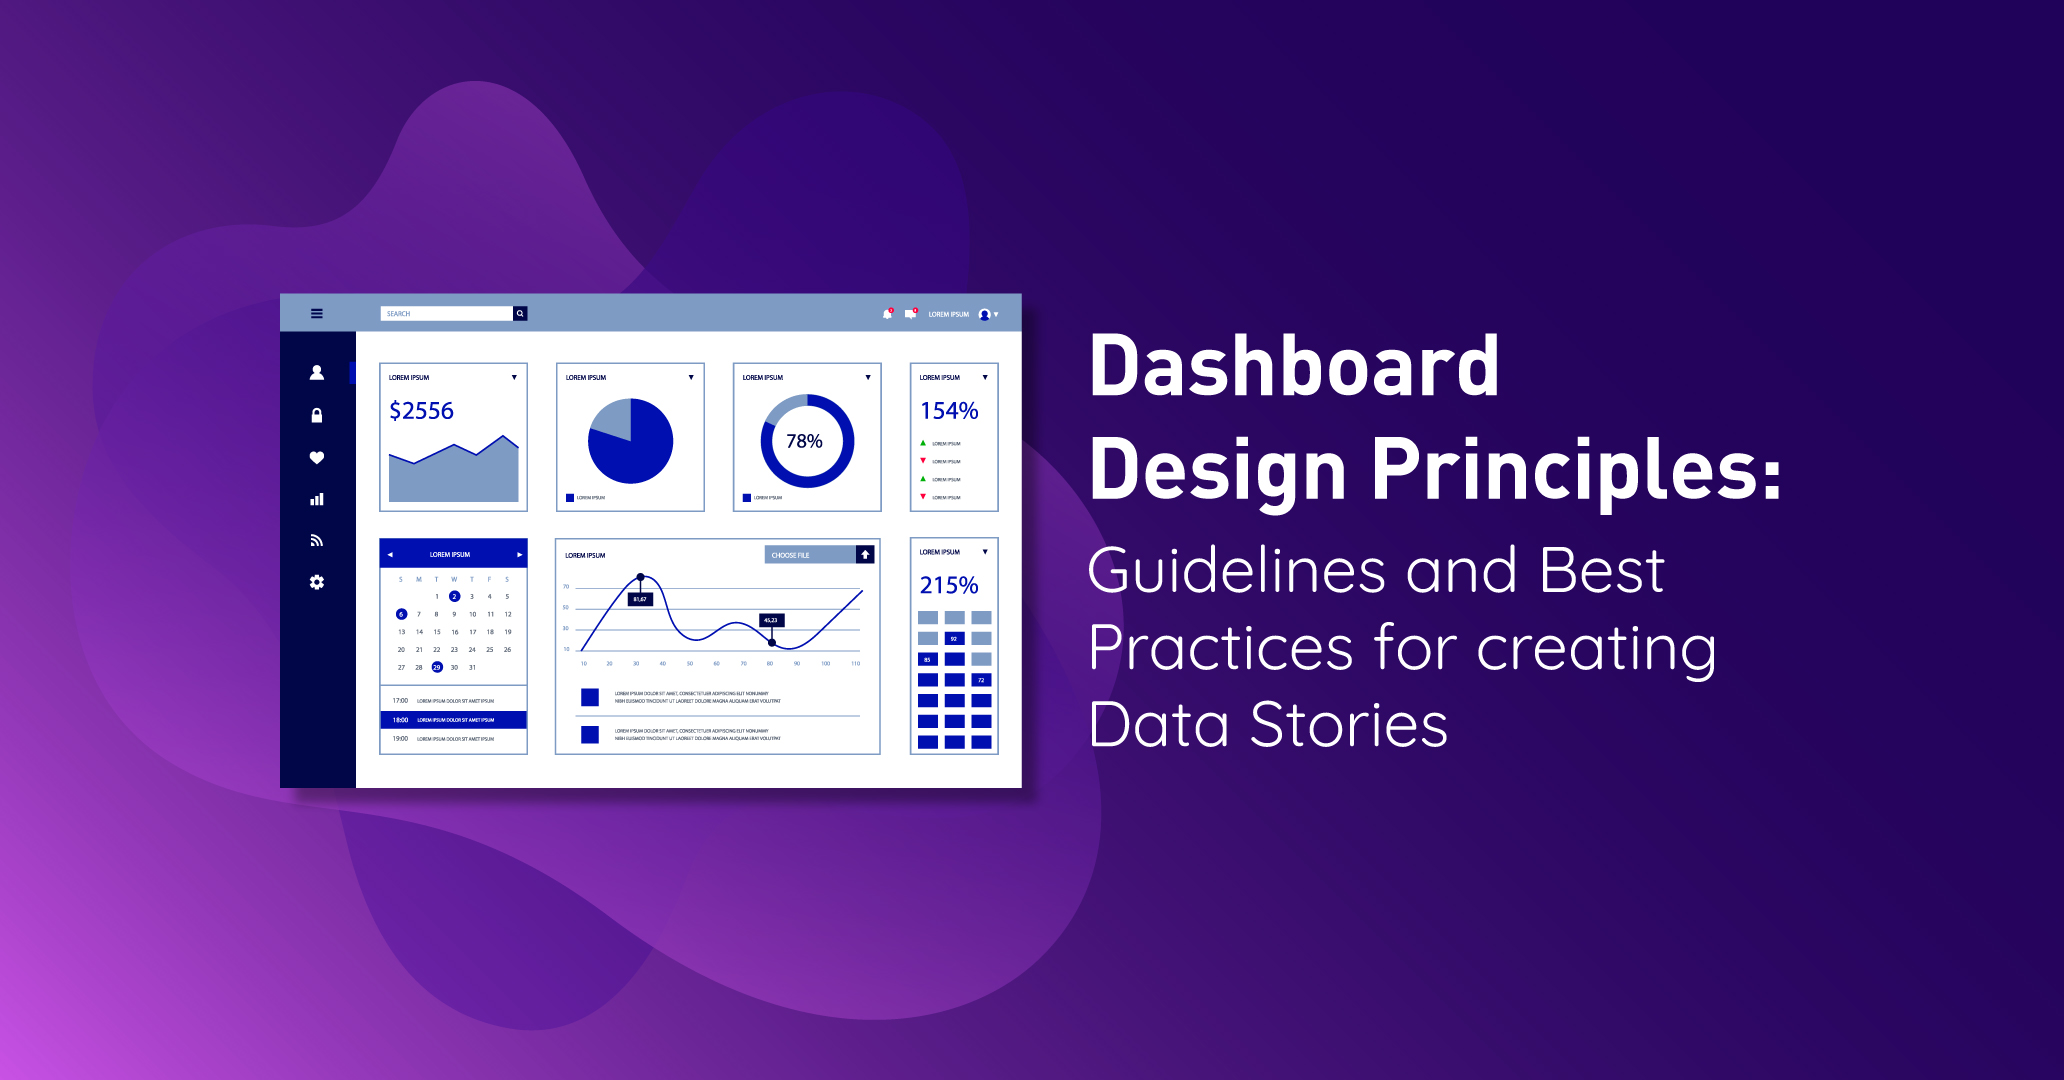
Dashboard Design Principles- Guidelines & Best Practices for creating Data Stories

Dashboard design principles refer to a set of guidelines and best practices for creating effective and visually appealing dashboards. Dashboards are information management tools that provide a consolidated and visual representation of data, metrics, and Key Performance Indicators (KPIs).
- Providing Information Context:
By providing context and comparison values, we can determine the significance of those numbers, whether they are positive or negative, and whether they represent common or exceptional performance. The inclusion of comparison values is crucial as it gives meaning to the numbers on a Dashboard, allowing users to make informed decisions and take necessary actions. A well-designed management dashboard emphasizes high-level metrics that are easily comparable, enabling users to grasp the information visually and understand the story it conveys. - Purpose-Driven Design:
Clearly define the purpose of the Dashboard and its intended audience. Align the design elements and metrics with the specific goals and objectives of the users or Dashboard consumers. - User-Centric Design:
Persona specific Dashboards should be designed with answer to specific questions to make decisions. - Simplicity:
Keep the dashboard design clean, uncluttered, and intuitive. Avoid overwhelming users with excessive information or complex visualizations. Use concise and meaningful labels, headings, and icons. - Visual Hierarchy:
Prioritize and emphasize important information by using visual cues such as size, color, contrast, and positioning. Guide the user’s attention to key metrics or insights. - Consistency:
Maintain a consistent layout, color scheme, typography, and design elements throughout the Dashboard. Consistency helps users navigate the Dashboard easily and promotes a cohesive user experience. - Use of Whitespace:
Utilize whitespace (empty or blank space) properly to separate and organize different sections of the Dashboard. Whitespace improves readability, reduces visual noise, and enhances overall aesthetics. - Information Grouping:
Group related information and metrics together logically. Use clear headings, sections, and visual separators to differentiate different components. Grouping facilitates data comprehension and makes it easier for users to find relevant information. - Using Appropriate Visualizations:
Choose appropriate data visualization (e.g., charts, graphs, tables, gauges) based on the nature of the data and the insights you want to convey. Select visualizations that effectively represent the data while being easy to understand. - Interactivity:
Incorporate interactive elements, such as filters, drill-downs, or tooltips, to enable users to explore the data further and gain deeper insights. Interactivity enhances user engagement and helps user understanding data better. - Accommodate User Feedback:
Iterate and refine the dashboard design based on user feedback and usability. Regularly gather input from the intended audience to identify areas for improvement and enhance the overall decision making. - Data Storytelling:
Display only the most relevant and important information on the dashboard. Focus on key performance indicators (KPIs) and metrics that align with the users’ goals. Every Data Story should have 3 elements: Data, Narrative and Visuals. Data and Visuals will enlighten the users, Visuals and Narrative will engage the users and Data and Narrative will explain. - Performance Optimization:
Average Dashboard load time should be between 3 to 5 seconds only. Avoid excessive data loading or complex calculations that may slow down the user experience.
***
Intellify believes in creating single source of truth from multi data sources and provide state-of-the-art data infrastructure to improve, enhance and grow their business sustainably.
If you are looking to adopt a data driven decision making for your business, feel free to get in touch with our experts by clicking here.
