
Confusion Matrix and parameters to evaluate Machine Learning Model
What is confusion Matrix?
A confusion matrix is a summary of predication results on a classification problem. The number of correct and incorrect predictions are summarized with count values and broken down by each class. This is the key to the confusion matrix.
The confusion matrix shows the ways in which your classification model is confused when it makes predictions.
It gives you an Insight not only into the errors being made by your classifier but more importantly the types of errors that are being made.
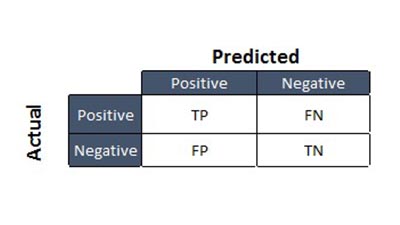
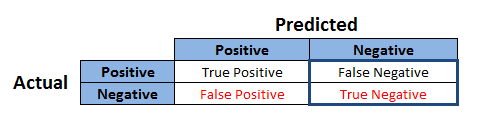
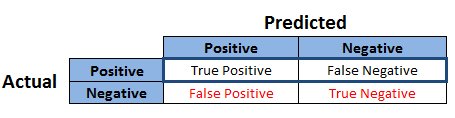
Let’s look at the confusion matrix and its parts:
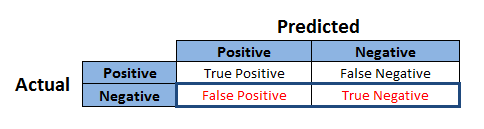
- True Positives (TP):These are cases in which we predicted Positive and Actual Also Positive
- True Negatives (TN):We predicted Negative and Actual also Negative
- False Positives (FP):We predicted Positive but actual have Negative. (Also known as a “Type I error.”)
- False Negatives (FN):We predicted Negative but actual have Positive. (Also known as a “Type II error.”)
By using confusion matrix we calculate the performance of pipelines and Its depends on four terms Accuracy, Precision, Recall and F1-Score(F1-measure) all are explain in details.
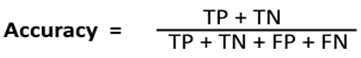
Accuracy: is accuracy id the indicator for model correctness. To calculate accuracy of particular model we can use below formula
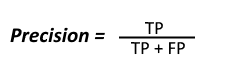
Precision (Positive Predictive Value): To get the value of precision we divide the Total Number of Correctly Classified positive examples by the total number of predicted positive examples. High Precision indicates an example labelled as positive is indeed positive (small number of FP).
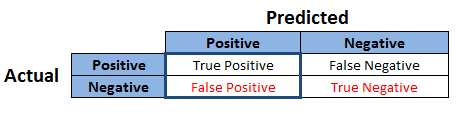
Negative Predictive Value: This is Ratio of Number of True Negatives to Number of Negative calls.
![]()
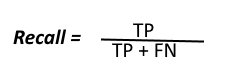
Recall (Sensitivity): Recall can be defined as the ratio of the total number of correctly classified positive examples divide to the total number of positive examples. High Recall indicates the class is correctly recognised (small number of FN).
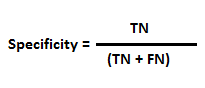
Specificity: Specificity is also called as True Negative Rate. Measures the proportion of Actual Negatives that are correctly identified as such (e.g. the percentage of healthy people who are correctly identified as not having the condition)
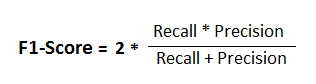
F1-score: It is difficult to compare two models with low precision and high recall or vice versa. So to make them comparable, we use F1-Score. F1-score helps to measure Recall and Precision at the same time. It uses Harmonic Mean in place of Arithmetic Mean by punishing the extreme values more.
Accuracy, Precision, Recall and F1 Score parameters are used for calculating the robustness of any Machine Learning Model. Every ML model should publish these numbers.[/vc_column_text][/vc_column][vc_column width=”1/4″][stm_sidebar sidebar=”527″][/vc_column][/vc_row][vc_row][vc_column][stm_post_bottom][stm_post_about_author][stm_post_comments][/vc_column][/vc_row]