Real-Time Operational Dashboards:
Architecture and Implementation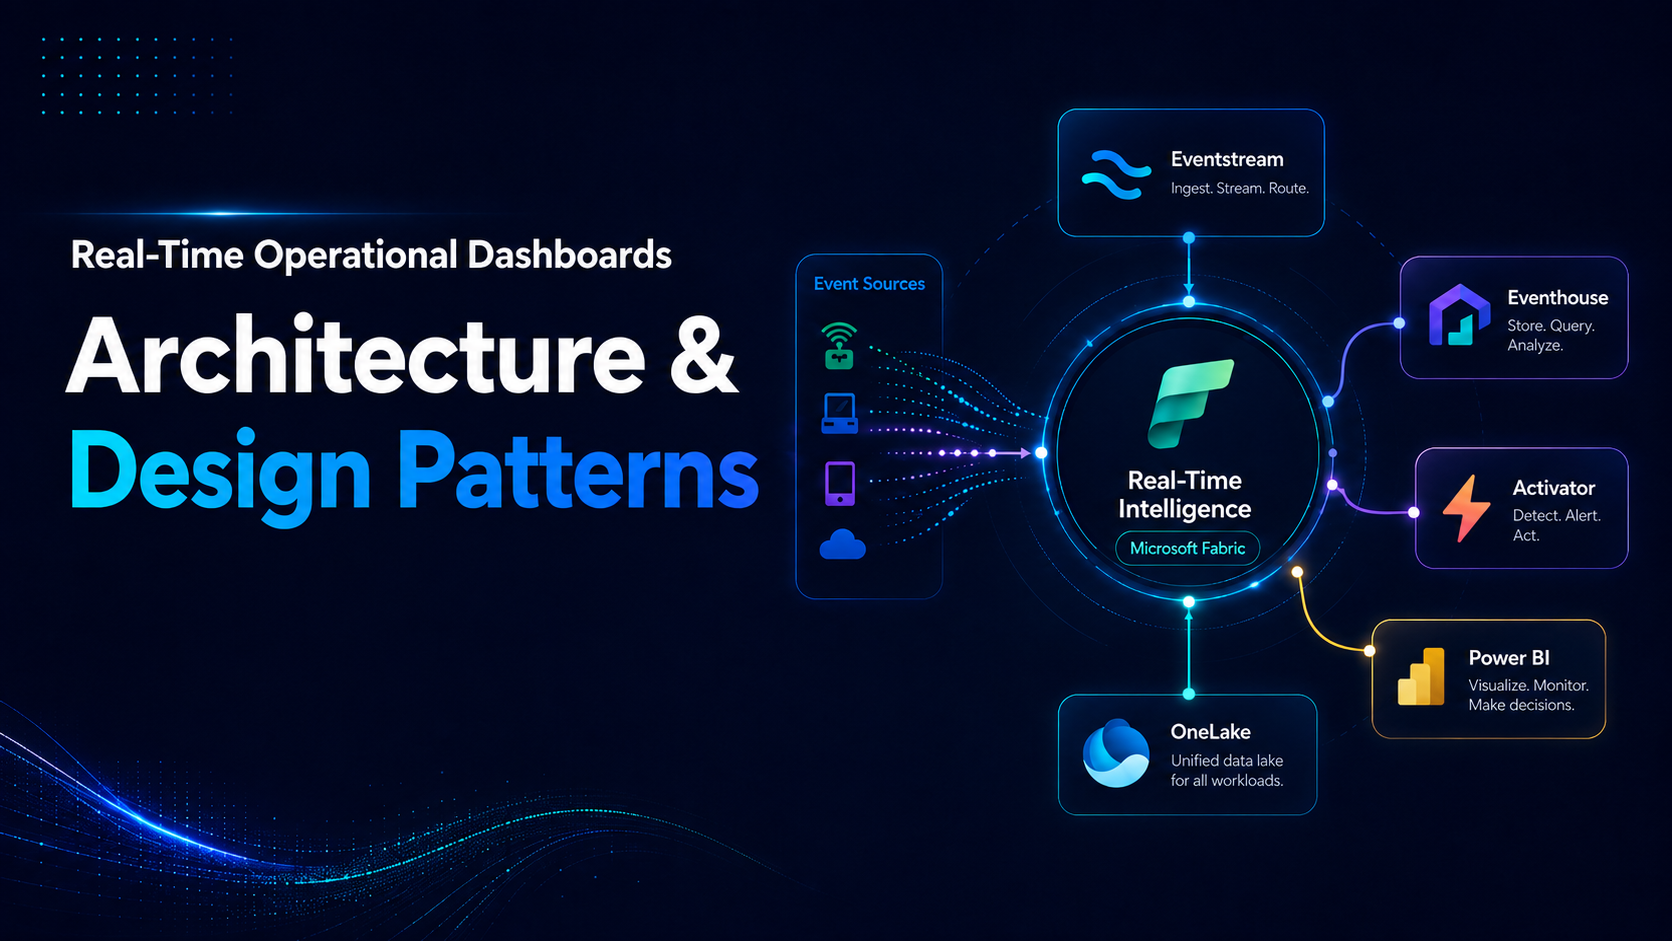
Table of Content
The Real-Time Operational Challenge
What Are Real-Time Operational Dashboards?
Why Microsoft Fabric RTI & Why Now ?
Core Pillars of Real-Time Intelligence
End-to-End Architecture on Microsoft Fabric
KQL in Practice – Querying Live Data
The Real-Time Operational Challenge
Most enterprise dashboards still show data from yesterday. In an era where IoT sensors generate thousands of events per second, financial transactions settle in milliseconds, and logistics systems track shipments across continents in real time, the traditional batch-refresh BI model is no longer sufficient for operational decision-making.
Over the last three years, working with clients across manufacturing, logistics, and financial services, a consistent pattern emerges: organizations have invested heavily in analytical BI, Power BI semantic models, star schema data warehouses, carefully designed dashboards, but the operational layer is still running on email alerts, manual refresh cycles, and gut feel.
The gap is not a tool problem. It is an architecture problem. The following pain points are universal across industries:
• Batch refresh cycles of 15 to 60 minutes leave floor managers operating on stale KPIs during peak operational windows
• Threshold breach alerts arrive via email minutes after the SLA has already been violated
• Event data from IoT devices, ERP change streams, and Kafka topics is siloed, no unified operational view
• Traditional ETL pipelines introduce 5 to 20 minutes of latency that makes “real-time” dashboards a misnomer
• Dashboards are passive, they show what happened but cannot trigger automated corrective action
• No lineage or traceability from a streaming event at source to the KPI visual on the dashboard
• IT teams maintain separate stacks for streaming (Kafka, Spark) and visualization (Power BI) with no unified governance
Real-Time Intelligence on Microsoft Fabric addresses this challenge at the architectural level, not by bolting real-time capabilities onto existing batch pipelines, but by providing a purpose-built, unified platform for streaming ingestion, analytical storage, automated alerting, and live visualization within a single governed data estate.
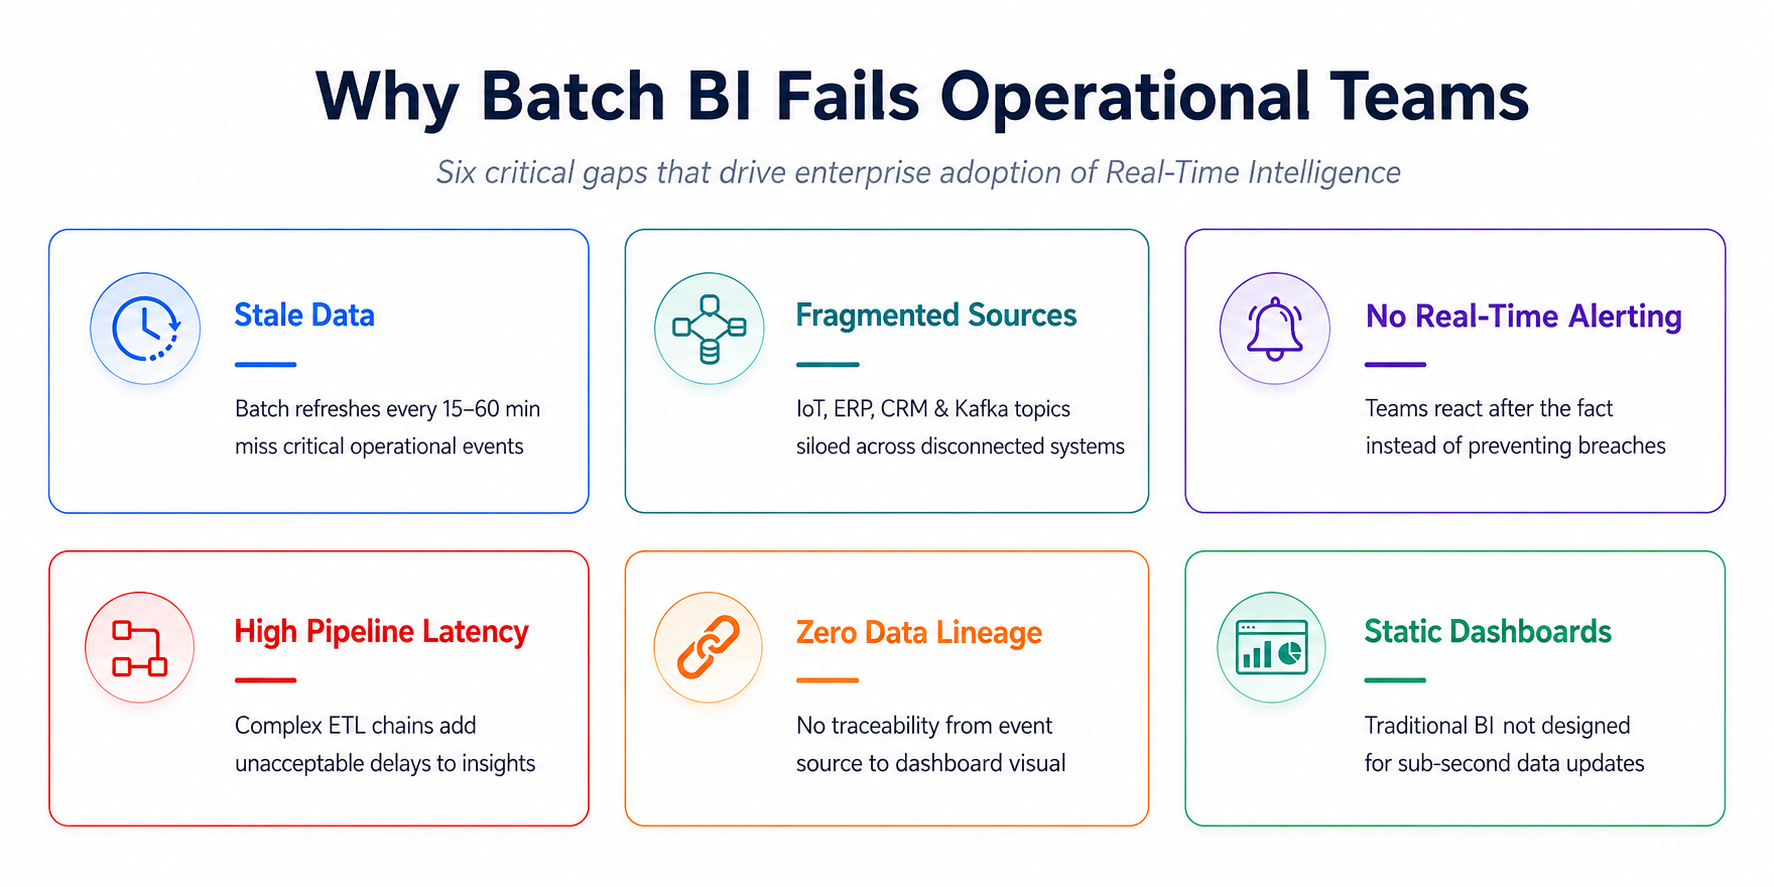
Figure 1: Six Critical Gaps That Drive Enterprise Demand for Real-Time Operational Dashboards
What Are Real-Time Operational Dashboards?
A real-time operational dashboard is a continuously updated visualization interface that reflects the current state of a business process, operational system, or event stream with data freshness measured in seconds or sub-seconds, not hours or days.
The defining characteristic is not just fast data. It is the combination of fast data, automated intelligence, and the ability to close the loop from observation to action without human intervention in the monitoring loop.
Operational vs Analytical Dashboards
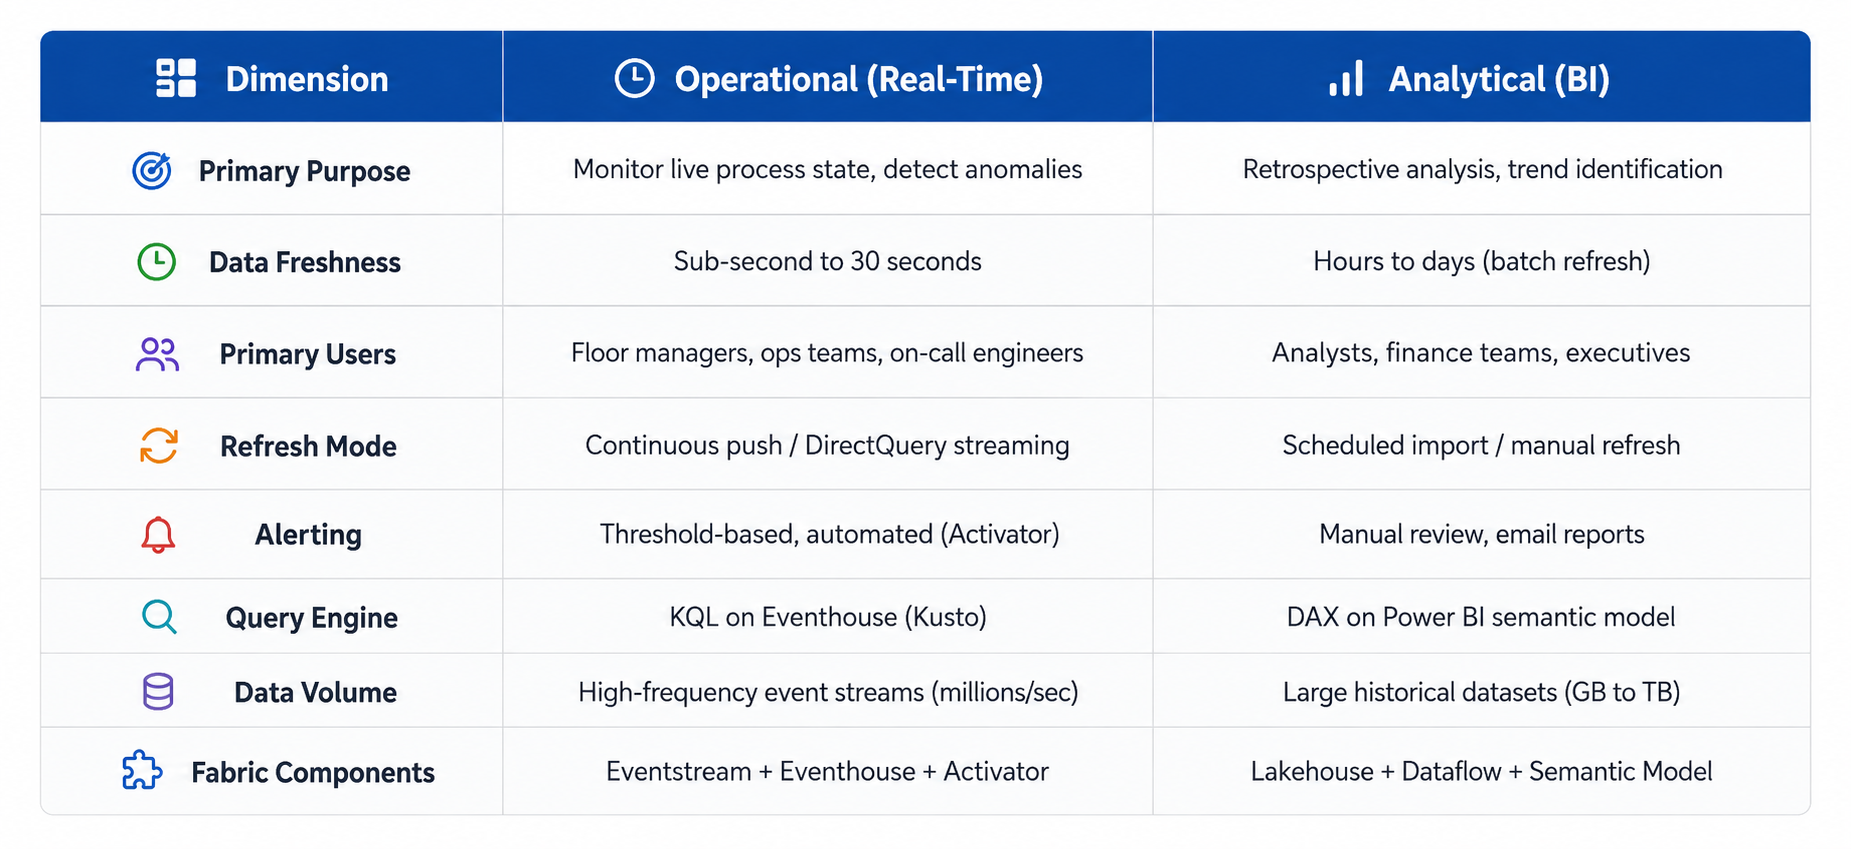
Figure 2: Operational vs Analytical Dashboards
Why Microsoft Fabric RTI & Why Now ?
Before Microsoft Fabric RTI, building a real-time operational dashboard for an enterprise client meant assembling a heterogeneous stack: Azure Event Hubs for ingestion, Azure Stream Analytics or Databricks Structured Streaming for processing, Azure Data Explorer (ADX) for storage, custom alerting scripts or Azure Logic Apps for notifications, and Power BI on top. Each component required separate configuration, monitoring, security setup, and team expertise.
Microsoft Fabric RTI collapses this stack into a unified platform and the operational benefits are substantial:
1. Unified Platform – No Integration Tax
Before Microsoft Fabric RTI, building a real-time operational dashboard for an enterprise client meant assembling a heterogeneous stack: Azure Event Hubs for ingestion, Azure Stream Analytics or Databricks Structured Streaming for processing, Azure Data Explorer (ADX) for storage, custom alerting scripts or Azure Logic Apps for notifications, and Power BI on top. Each component required separate configuration, monitoring, security setup, and team expertise.
Microsoft Fabric RTI collapses this stack into a unified platform and the operational benefits are substantial:
2. Eventhouse – Purpose-Built for Streaming Analytics
Eventhouse is not a general-purpose database. It is a managed instance of Azure Data Explorer (Kusto), optimized specifically for time-series data, high-frequency ingestion, and analytical queries over recent data windows. It handles millions of events per second with millisecond query latency making it the ideal backing store for operational dashboards.
3. KQL – The Right Query Language for Streaming Data
DAX is the right language for dimensional data models and business metrics. KQL (Kusto Query Language) is the right language for time-series event data. KQL’s built-in operators summarize, bin(), make-series, mv-expand, anomaly detection are designed for the kinds of queries operational dashboards need: windowed aggregations, trend detection, threshold analysis, and pattern matching over high-frequency event streams.
4. Activator – Closing the Loop Automatically
Most BI platforms stop at visualization. Fabric Activator extends the RTI platform into automated action detecting conditions in streaming data and triggering responses without human intervention. This is the architectural shift that transforms a passive monitoring dashboard into an active operational intelligence system.
5. OneLake – Governance Across Real-Time and Historical Data
All data processed through Fabric RTI lands in OneLake “the unified data lake” that underpins all Fabric workloads. This means real-time event data is immediately available for historical analysis, machine learning, and compliance reporting through the same governance policies that apply to batch data eliminating the governance gap between streaming and analytical systems.
The decision to adopt Fabric RTI is not primarily about replacing existing BI tools. It is about adding an operational intelligence layer on top of your existing analytical foundation enabling the enterprise to both analyze the past and act on the present from the same governed platform.
Core Pillars of Real-Time Intelligence
Enterprise RTI implementations are built on five foundational capabilities.
Each pillar is implemented by a specific Fabric component, and the architecture is only as strong as the weakest link in this chain:
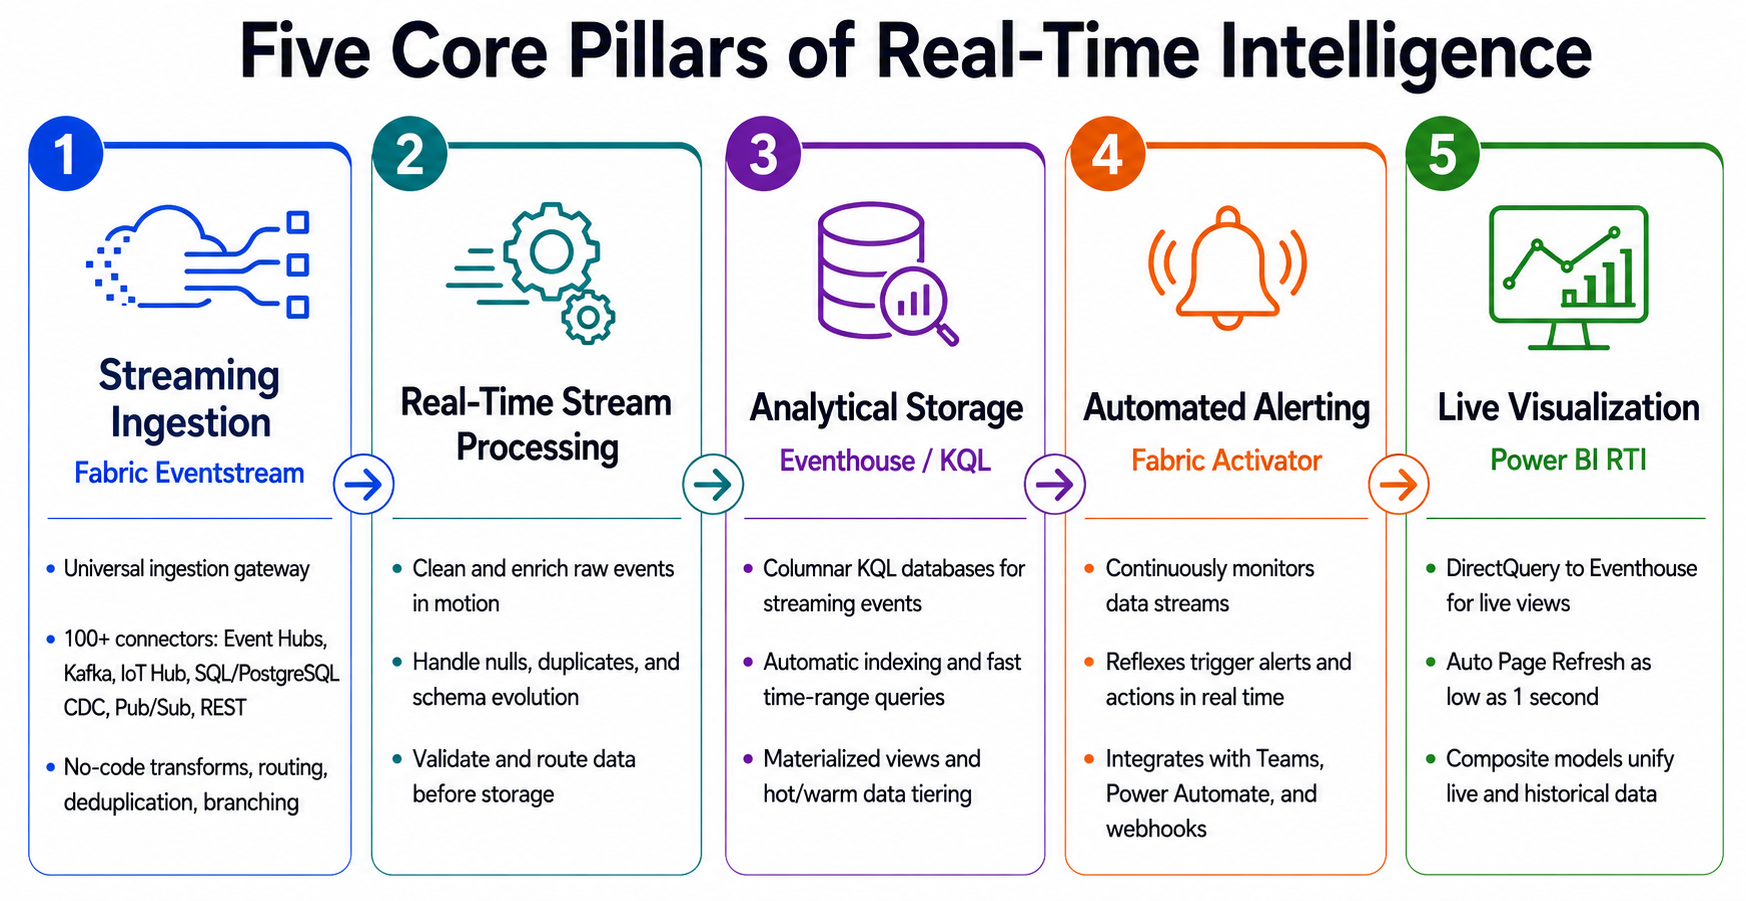
Figure 3: Five Core Pillars of Real-Time Intelligence
End-to-End Architecture on Microsoft Fabric
The following four-layer architecture represents the pattern we implement for enterprise RTI clients. Each layer has a clear responsibility and well-defined interfaces to adjacent layers, enabling independent scaling and evolution of each component without breaking the end-to-end pipeline.
Layer 1 – Ingest
All external event sources connect to a single Fabric Eventstream instance as the ingestion gateway. This includes IoT sensors via MQTT bridges, database change data capture (CDC) streams from SQL Server and PostgreSQL, Azure Event Hubs topics from upstream microservices, Kafka topics from on-premises operational systems, and REST webhook endpoints from third-party SaaS platforms.
Using a single ingestion gateway prevents the proliferation of point-to-point connections that makes real-time pipelines fragile at scale. Eventstream acts as the single pane of glass for all streaming data entering the Fabric workspace.
Layer 2 – Process
Within Eventstream, transformation operators apply business logic to the incoming event streams: field renaming and type casting to normalize schemas across sources, deduplication using event ID fields to eliminate duplicate CDC events, conditional routing to fan events to multiple destinations based on event type or device category, windowed aggregation for pre-computing metrics before storage, and schema evolution handling for Kafka topics with changing message structures.
Layer 3 – Store
Processed events land in one of two destinations depending on the latency requirement: Eventhouse KQL Database for the hot path (events from the last 24 to 72 hours that require sub-second query response for live dashboards), and Fabric Lakehouse (Delta/Parquet on OneLake) for the warm and cold path (historical data retained for trend analysis, ML feature engineering, and compliance reporting).
Within Eventhouse, table design follows a two-tier pattern: raw event tables receive all incoming events with full fidelity, and materialized views pre-compute the aggregations required by dashboard KPIs reducing dashboard query load and ensuring consistent KPI definitions across all consumers.
Layer 4 – Visualise and Act
Power BI RTI dashboards connect to Eventhouse via DirectQuery for live operational KPIs, with Auto Page Refresh set to match the operational latency budget of each use case. Fabric Activator monitors the same KQL tables and fires Teams notifications and Power Automate flows when KPI thresholds are breached. KQL Querysets in the Fabric workspace enable ad-hoc investigative queries for engineers responding to operational incidents.
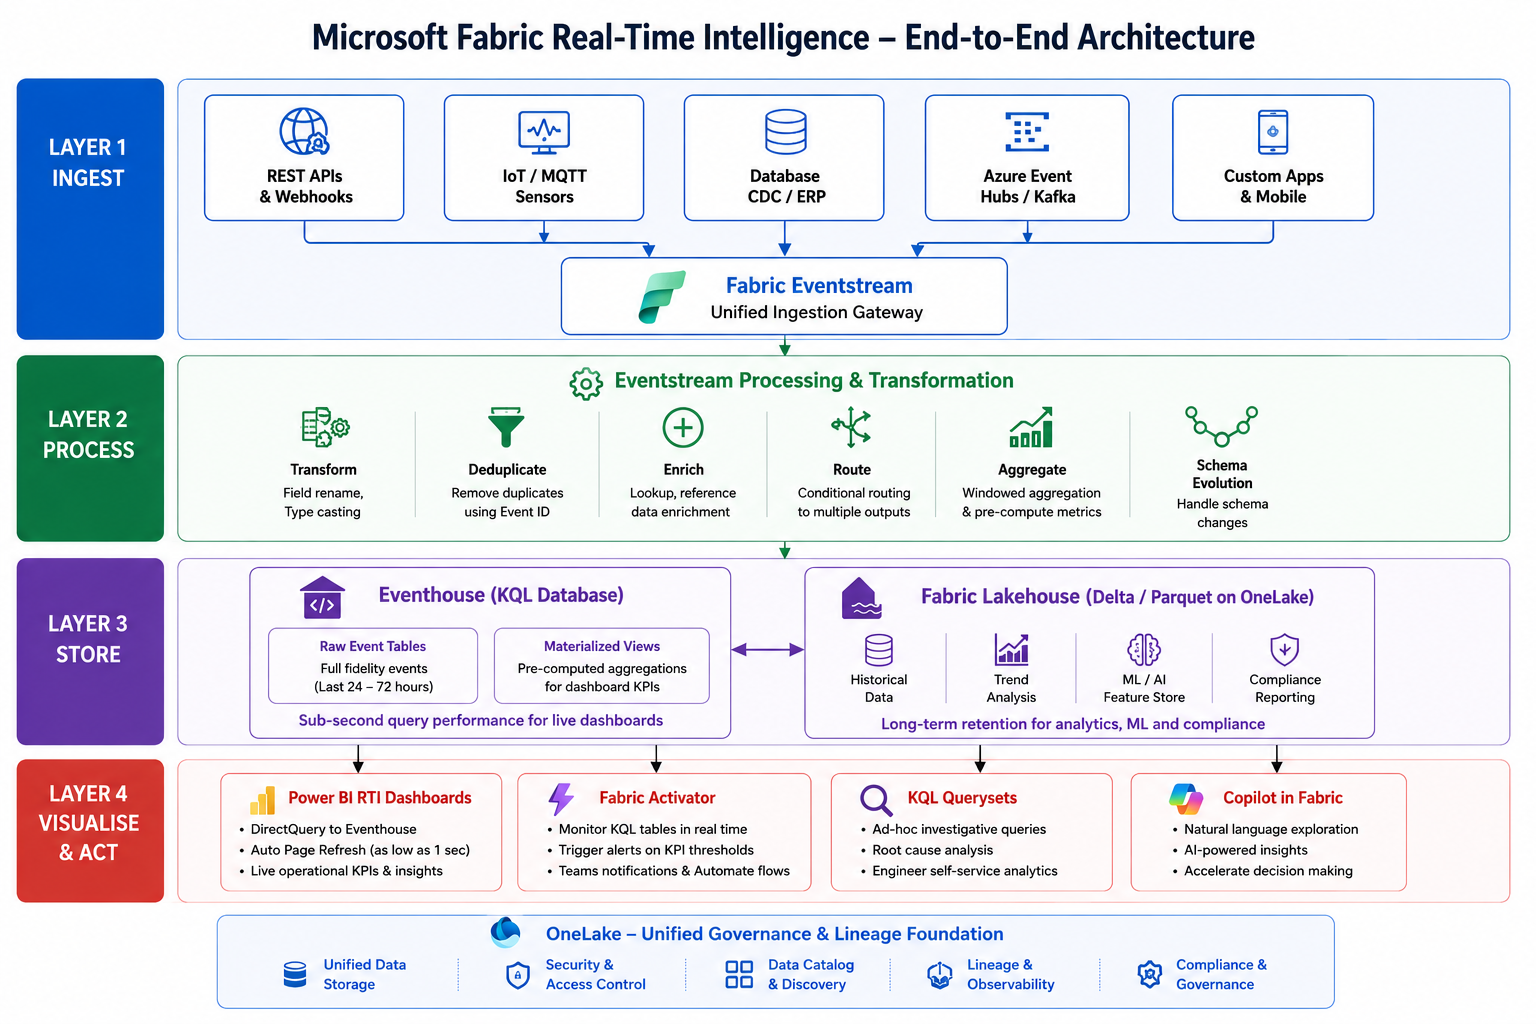
Figure 4: Microsoft Fabric RTI — Four-Layer End-to-End Architecture (Ingest > Process > Store > Visualise & Act)
Never connect Power BI directly to raw event tables in Eventhouse. Always create KQL materialized views or functions as the abstraction layer between the raw event store and the dashboard query layer. This decouples dashboard development from schema evolution in the underlying event tables.
KQL in Practice – Querying Live Data
KQL (Kusto Query Language) is the query interface for Eventhouse and the analytical engine that powers RTI dashboards. For Power BI developers coming from a DAX background, KQL feels familiar in structure, pipe-based, column-oriented, declarative, but is purpose-built for time-series and high-frequency event data.
The following KQL patterns are the most frequently used in operational dashboard implementations:
Pattern 1 – Real-Time KPI with Time Window
This is the foundational query for any operational dashboard tile. It aggregates a metric over a recent time window the equivalent of a CALCULATE with time intelligence in DAX, but running live over streaming event data:
EquipmentTelemetry
| where ingestion_time() > ago(5m)
| summarize AvgTemperature = avg(Temperature),
MaxTemperature = max(Temperature),
EventCount = count()
by DeviceId, bin(Timestamp, 1m)
| order by Timestamp desc
Pattern 2 – Threshold Breach Detection
This query powers Activator reflex rules. It identifies devices currently exceeding an operational threshold and is evaluated continuously by Activator to trigger alerts the moment a breach is detected:
EquipmentTelemetry
| where Timestamp > ago(30s)
| summarize LatestTemp = arg_max(Timestamp, Temperature) by DeviceId
| where Temperature > 85.0
| project DeviceId, Temperature, Timestamp,
AlertMessage = strcat("BREACH: Device ", DeviceId,
" at ", tostring(Temperature), "C")
Pattern 3 – Materialized View for Dashboard Performance
Materialized views pre-compute aggregations that would otherwise require full table scans on every dashboard refresh. This is critical for operational dashboards with Auto Page Refresh enabled at 1 to 5 second intervals:
.create materialized-view with (backfill=true)
EquipmentHourlySummary on table EquipmentTelemetry
{
EquipmentTelemetry
| summarize AvgTemp = avg(Temperature),
MaxTemp = max(Temperature),
TotalEvents = count()
by DeviceId, PlantId, bin(Timestamp, 1h)
}
.create materialized-view with (backfill=true)
EquipmentHourlySummary on table EquipmentTelemetry
{
EquipmentTelemetry
| summarize AvgTemp = avg(Temperature),
MaxTemp = max(Temperature),
TotalEvents = count()
by DeviceId, PlantId, bin(Timestamp, 1h)
}
Pattern 4 – Joining Live Events with Reference Data
Operational dashboards often need to enrich streaming events with dimensional reference data device master records, plant hierarchies, shift schedules. In Eventhouse, lookup tables are loaded as static reference tables and joined at query time:
EquipmentTelemetry
| where Timestamp > ago(10m)
| join kind=leftouter (
DeviceMaster
| project DeviceId, DeviceName, PlantName, LineNumber
) on DeviceId
| summarize AvgTemp = avg(Temperature) by DeviceName, PlantName, LineNumber
| order by AvgTemp desc
}
Connecting KQL to Power BI
Power BI connects to Eventhouse via the native Kusto connector. The connection is configured as DirectQuery to ensure live data flows to the dashboard without import-mode caching. Key Power BI settings for RTI dashboards:
• Auto Page Refresh: Set Auto Page Refresh to 1 to 10 seconds depending on operational latency budget.
• Change Detection: Use “Change Detection” refresh type for dashboards where only specific tiles need live updates.
• Query Target: Point DirectQuery to KQL functions or materialized views never to raw event tables.
• Capacity: Use Report Server capacity or Fabric F64+ for sub-5-second APR intervals.
Fabric Activator – Turning Dashboards Into Action
The most transformative capability of Microsoft Fabric RTI is not the speed of data ingestion or the performance of KQL queries. It is Fabric Activator the component that closes the loop between operational observation and automated response.
In every RTI project we have delivered, the client’s initial ask is always a dashboard. The real business value, however, emerges when Activator removes the dependency on a human watching that dashboard 24 hours a day, 7 days a week.
How Activator Works
Activator operates on a simple but powerful model: it monitors a data stream or KQL query result continuously, evaluates a condition (the reflex rule) against incoming data, and fires a configured action when the condition is satisfied.
The Activator object model has three levels:
• Item: The Item that is being monitored (a device, a shipment, an order, a machine)
• Property: The Property of that item being evaluated (temperature, delay minutes, error rate)
• Reflex: The Reflex that defines the condition and the triggered action
Activator Reflex Conditions
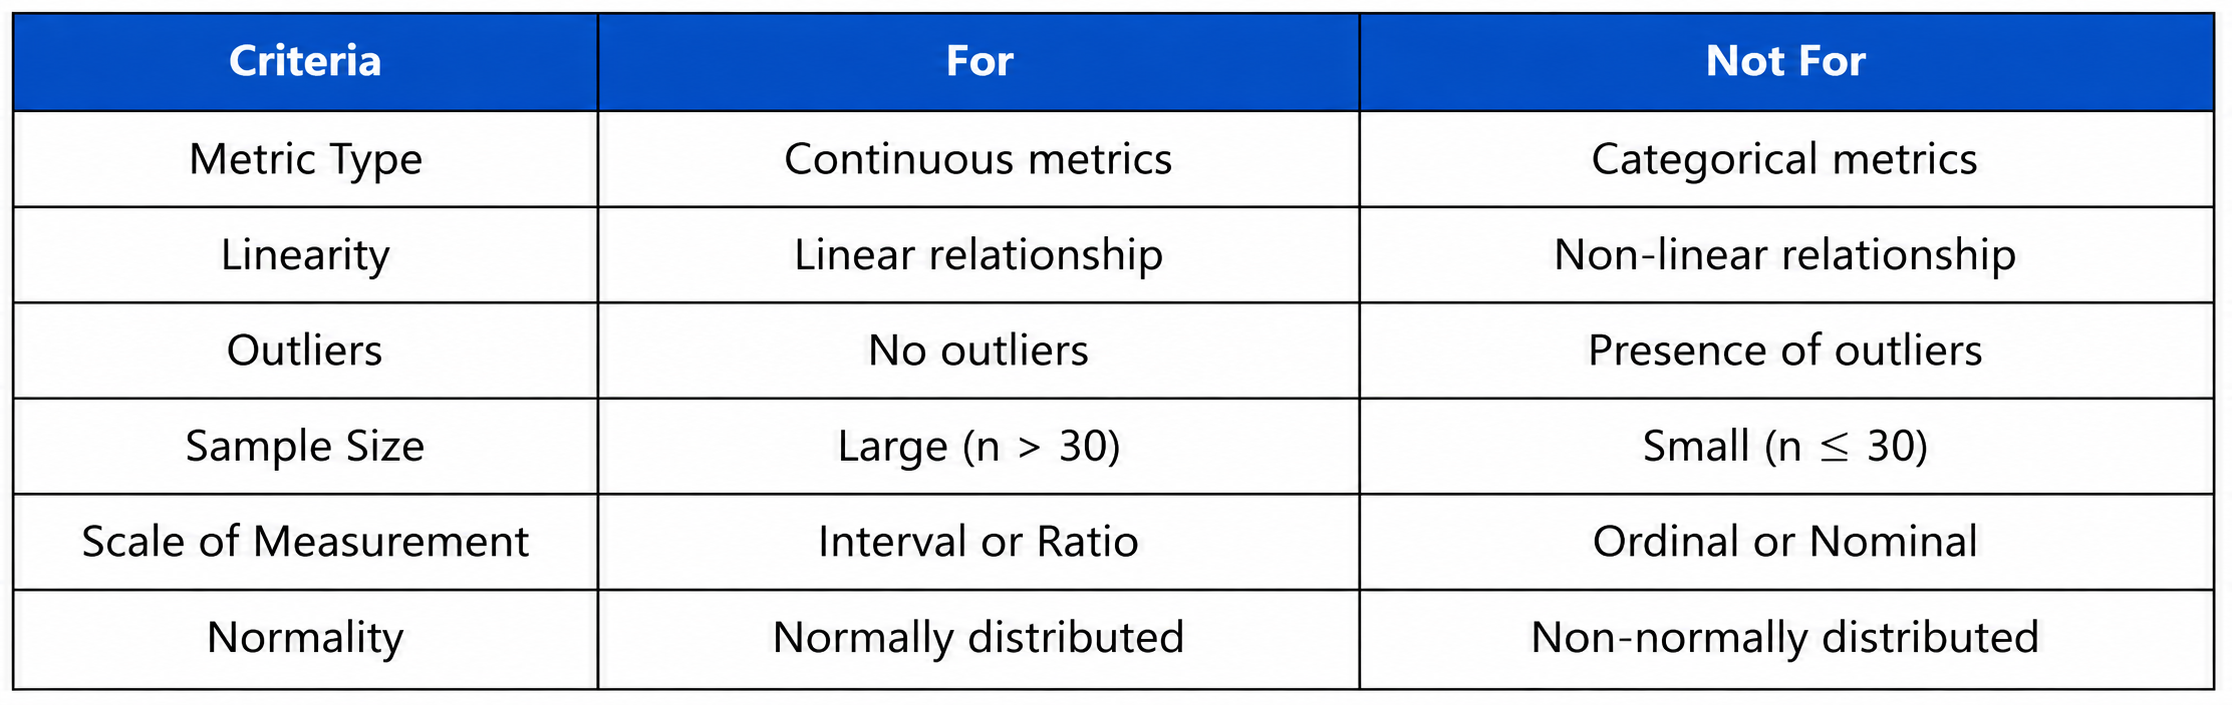
Activator Action Targets
When a reflex condition fires, Activator can trigger the following action targets all configurable without custom code:
• Teams Notification: Microsoft Teams message to a channel or individual with contextual alert data
• Email Alert: Email notification with dynamic content populated from the triggering event
• Power Automate: Power Automate flow for complex multi-step automated responses
• Custom Webhook: Custom webhook to trigger downstream API calls or system integrations
Real-World Scenario – Industrial IoT Monitoring
To ground the architecture in a concrete operational context, consider the following scenario representative of RTI implementations we have delivered for manufacturing clients in the equipment monitoring domain.
The Challenge
A manufacturing plant operates 200+ CNC machines and industrial presses across three production lines. Equipment temperature, vibration, and pressure sensors generate 50,000 events per minute during active production shifts. The existing monitoring approach: a SCADA system per production line, manual inspection rounds every 2 hours, and email alerts from a legacy threshold system with a 15-minute polling cycle.
The operational impact: unplanned downtime events that take 20 to 45 minutes to detect and respond to, because the monitoring system cannot identify thermal runaway conditions developing over a 5-minute window. Each unplanned downtime event costs approximately 4 hours of production capacity.
The Fabric RTI Solution
The solution architecture implements the Kappa Pattern — a single unified streaming pipeline from sensor to dashboard — with Activator providing the automated alerting layer:
• Ingestion: MQTT sensors stream telemetry to Azure IoT Hub
• Eventstream: Fabric Eventstream connects to IoT Hub, applies device ID normalization and null-value filtering
• Eventhouse: Processed events land in an Eventhouse KQL database partitioned by plant and shift
• KQL Views: Materialized views compute per-device 1-minute and 5-minute rolling averages
• Activator: Activator monitors the 5-minute rolling average for temperature > 82°C and fires Teams alerts to maintenance supervisors
• Power BI: Power BI RTI dashboard with 5-second Auto Page Refresh shows live plant floor status per line
The Results
The RTI implementation reduced mean time to detect (MTTD) for thermal anomalies from 15 minutes (legacy email polling) to under 45 seconds (Activator Teams alert). Maintenance teams can now respond to developing equipment conditions before they escalate to unplanned downtime shifting the operational posture from reactive to predictive.
The business value of RTI is not in the dashboard. It is in the reduction of MTTD (Mean Time to Detect) and MTTR (Mean Time to Respond) for operational events. Every architectural decision — latency budgets, Activator thresholds, KQL materialized views should be evaluated against its impact on these two operational metrics.
Blog Author